
Claude Plugins
Claude Code plugin marketplace
I just opened my own Claude Code plugin marketplace. The first session-metrics plugin tells you exactly how much each conversation cost — per turn, per cache write, per subagent, per advisor call — and classifies every assistant turn into one of nine “waste categories” so you can see at a glance whether a session was productive work or a retry-loop graveyard.
Here is what’s live on this plugin marketplace product page and how to install it. Read my article write up here.
What is the centminmod marketplace?
It’s a Claude Code plugin marketplace — a single GitHub repo (centminmod/claude-plugins) that the Claude Code /plugin system reads as a catalogue.
Add the marketplace once and any plugin published in it becomes available to install with one command. It’s separate from Anthropic’s official Plugin Directory and intended as a place to ship the small, opinionated tools I build for my own Claude Code workflow.
Add it to your Claude Code with:
/plugin marketplace add centminmod/claude-pluginsRun that inside the Claude Code terminal CLI (claude in your shell). The Claude Code desktop app install instructions can be found here.
Flagship plugin: session-metrics
Claude Code ships with /cost for the current session and a few rate-limit indicators — but if you want to know which turn burned the most tokens, which cache break cost you a re-prime, or how much your subagent dispatches actually contributed, there is no built-in answer. That’s the gap session-metrics fills.
It parses the JSONL conversation log Claude Code writes locally to ~/.claude/projects/ and produces a per-turn breakdown of:
Tokens & cost — input, output, cache-read, cache-write, total tokens, and dollar cost per turn, per session, per project, and per Claude Code instance.
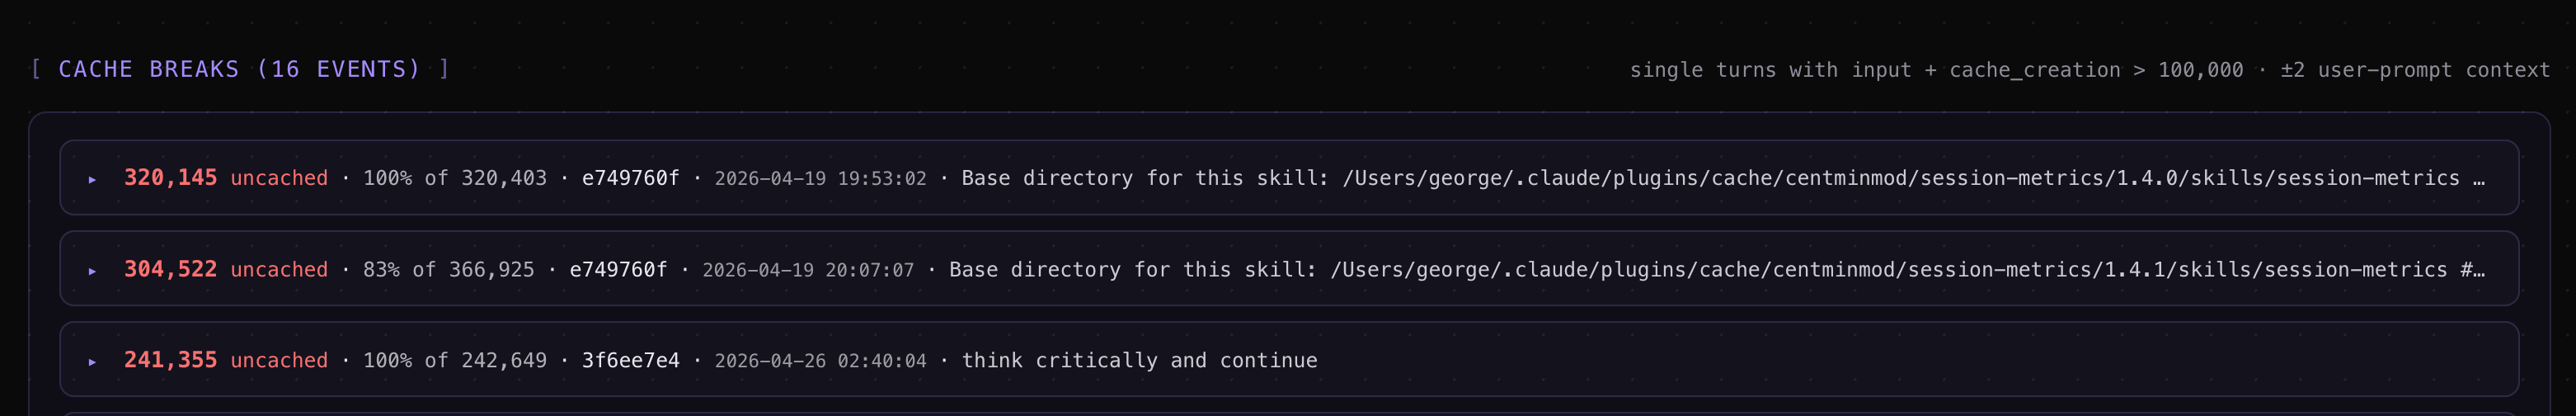
Cache efficiency — hit ratio per session, dollars saved vs. a hypothetical no-cache run, and inline
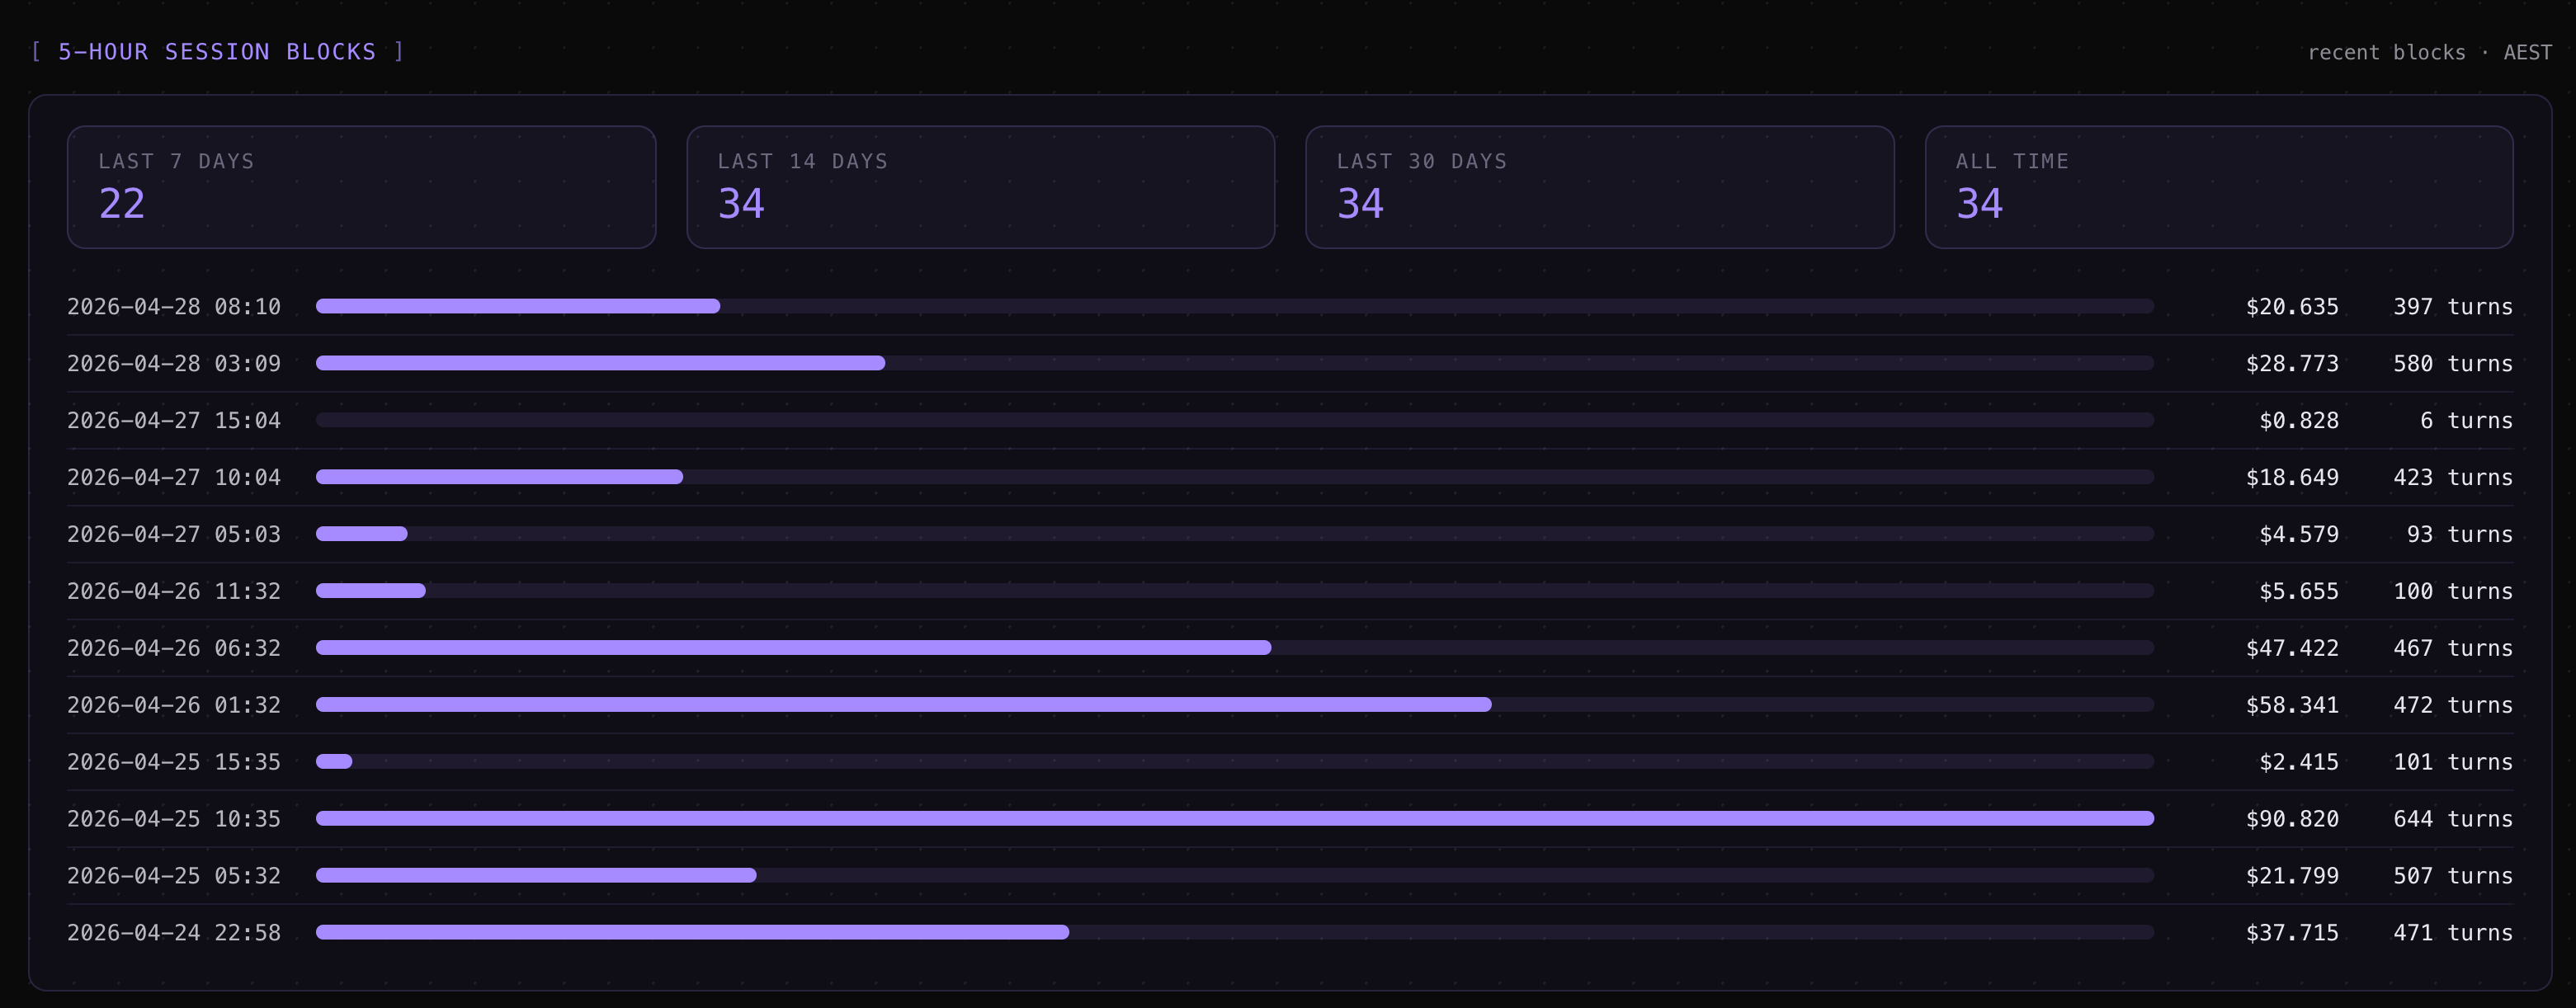
⚡cache-break markers in the timeline showing the exact turn where a cache eviction forced a re-prime.Activity patterns — 5-hour rate-limit session blocks, a hour-of-day + weekday-by-hour punchcard, and a 7-day-vs-prior-7-day weekly roll-up so you can see whether you’re tracking toward the weekly session cap.
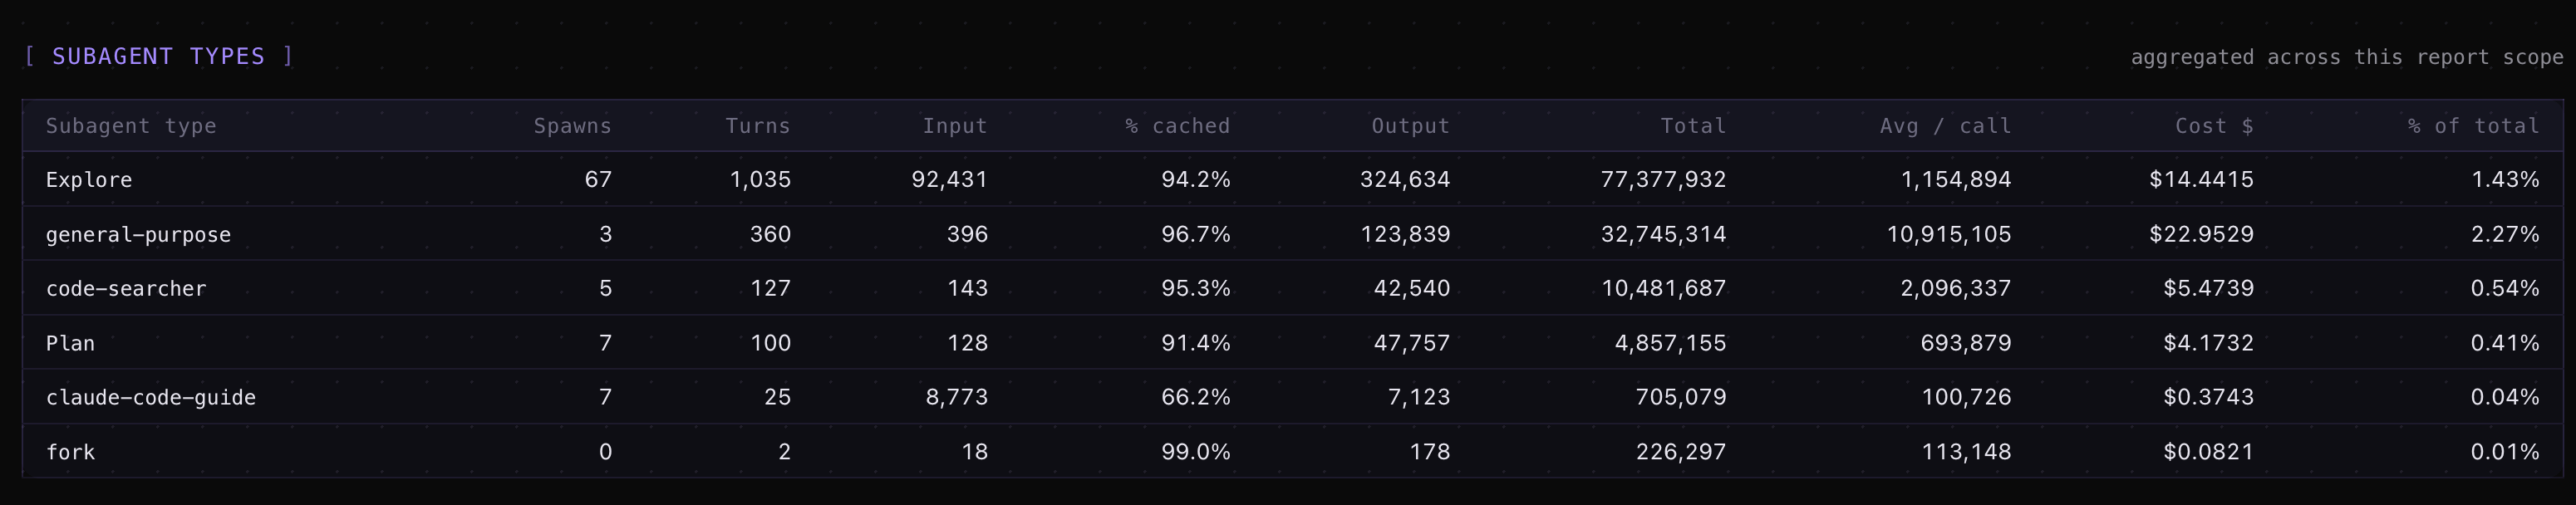
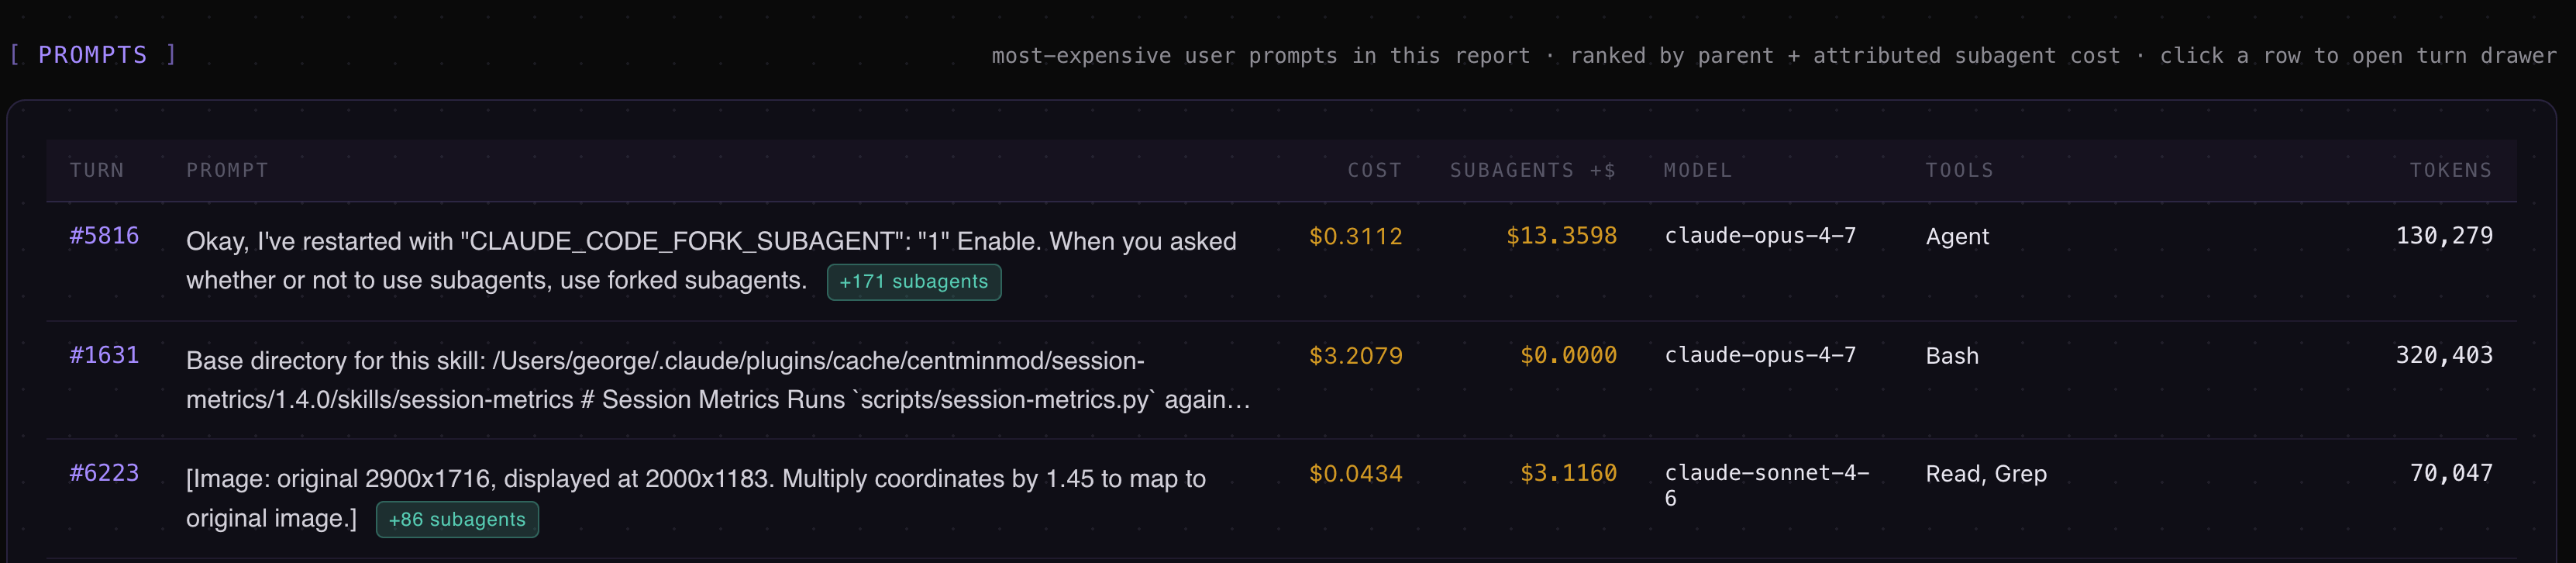
Subagent attribution — Task-tool subagent spend rolled up under the parent prompt that dispatched it, so a 200k-token subagent run doesn’t appear as an unattributed mystery line.
Advisor-call accounting — the new Claude Code advisor() tool gets its own dashboard card and per-turn cost correction (added in v1.25, last week).
Triggering it requires no slash-command memorisation. Just ask the agent something like “how much has this session cost?” or “show me total spend across all my Claude Code projects” and the skill auto-triggers, runs the parse, and writes a dashboard.
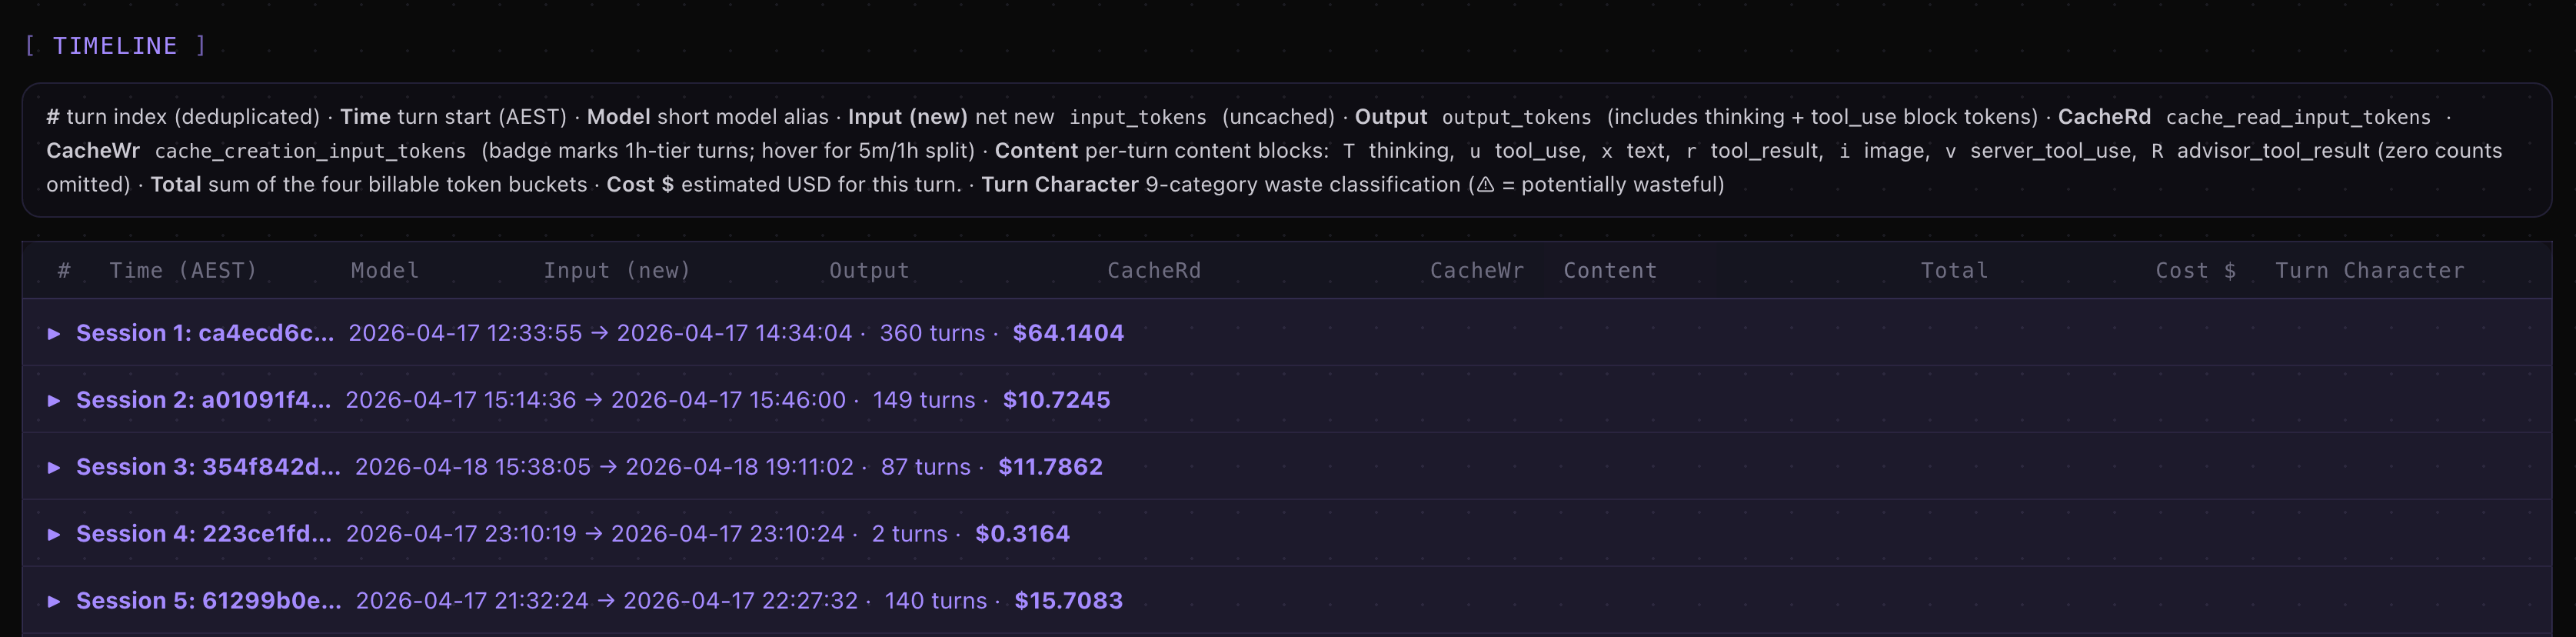
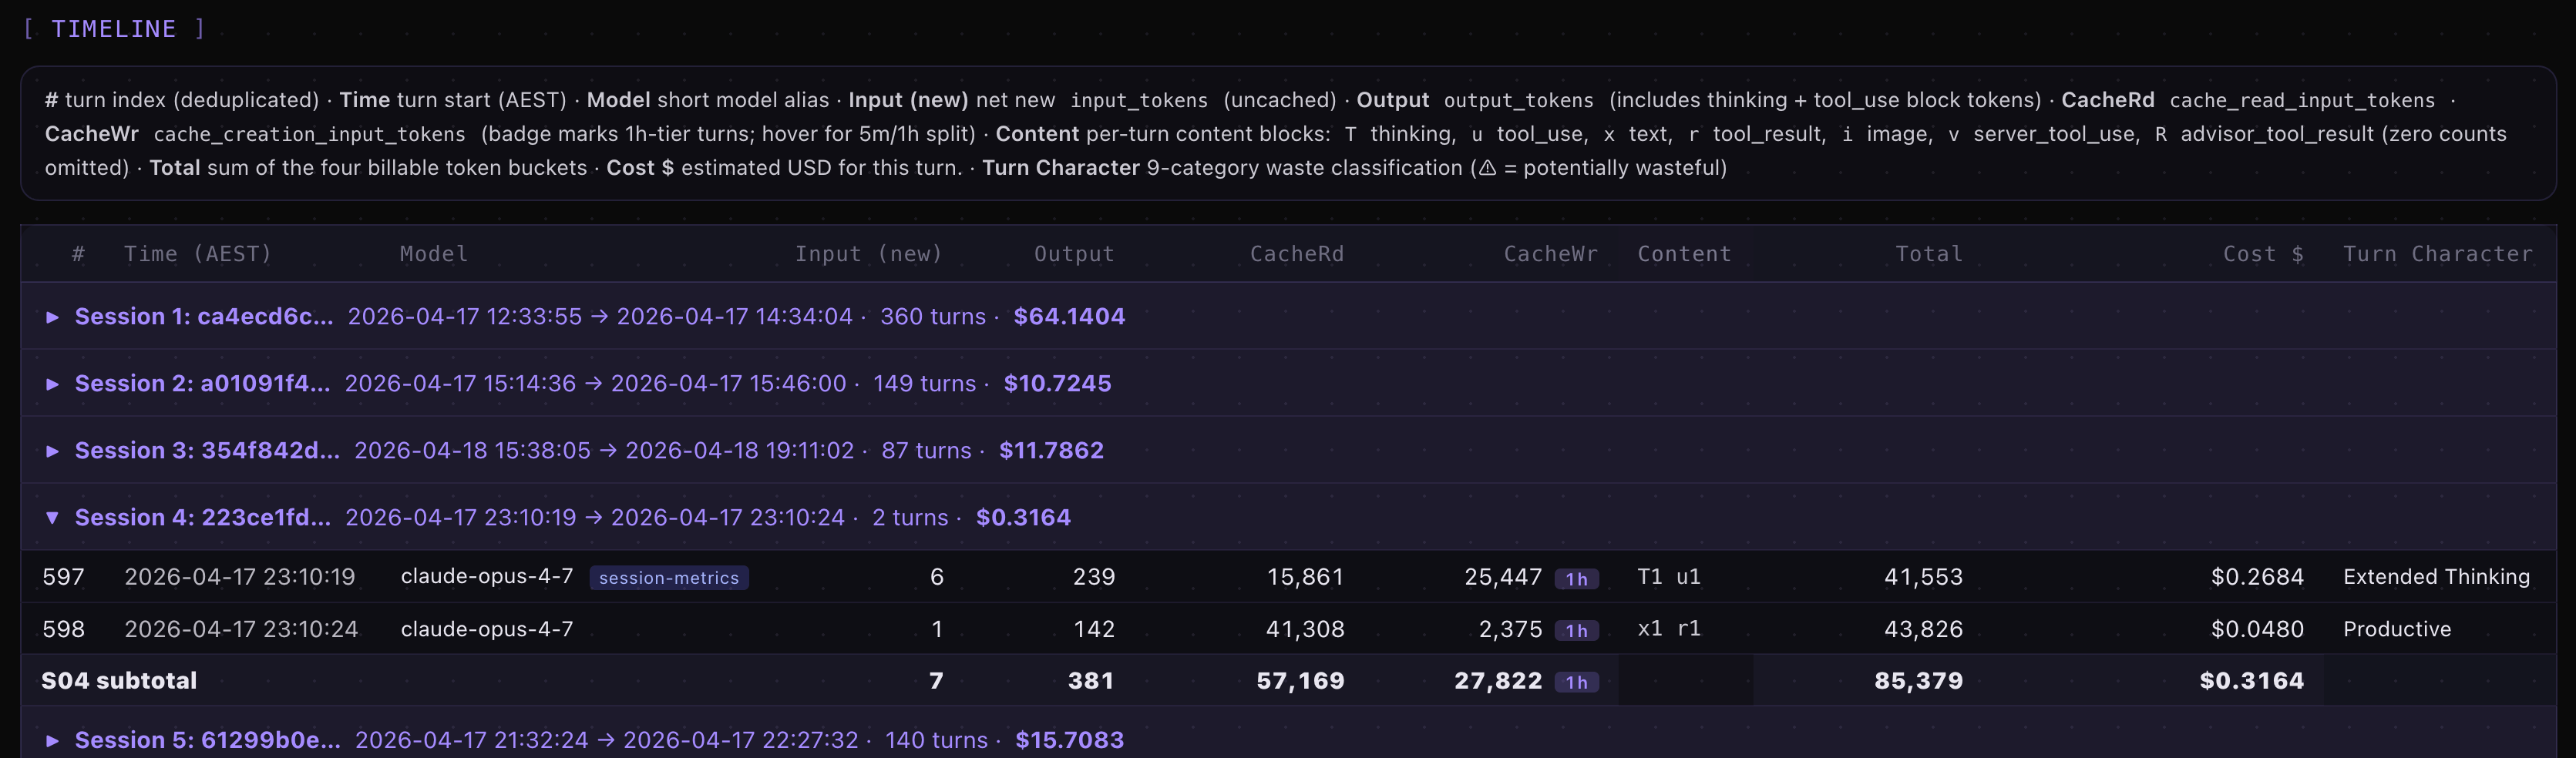
A tour of the dashboard
The default HTML output is a two-page split: a _dashboard.html summary page (cards, charts, drill-down sections) and a _detail.html per-turn timeline. Pass --single-page to collapse them into one file.
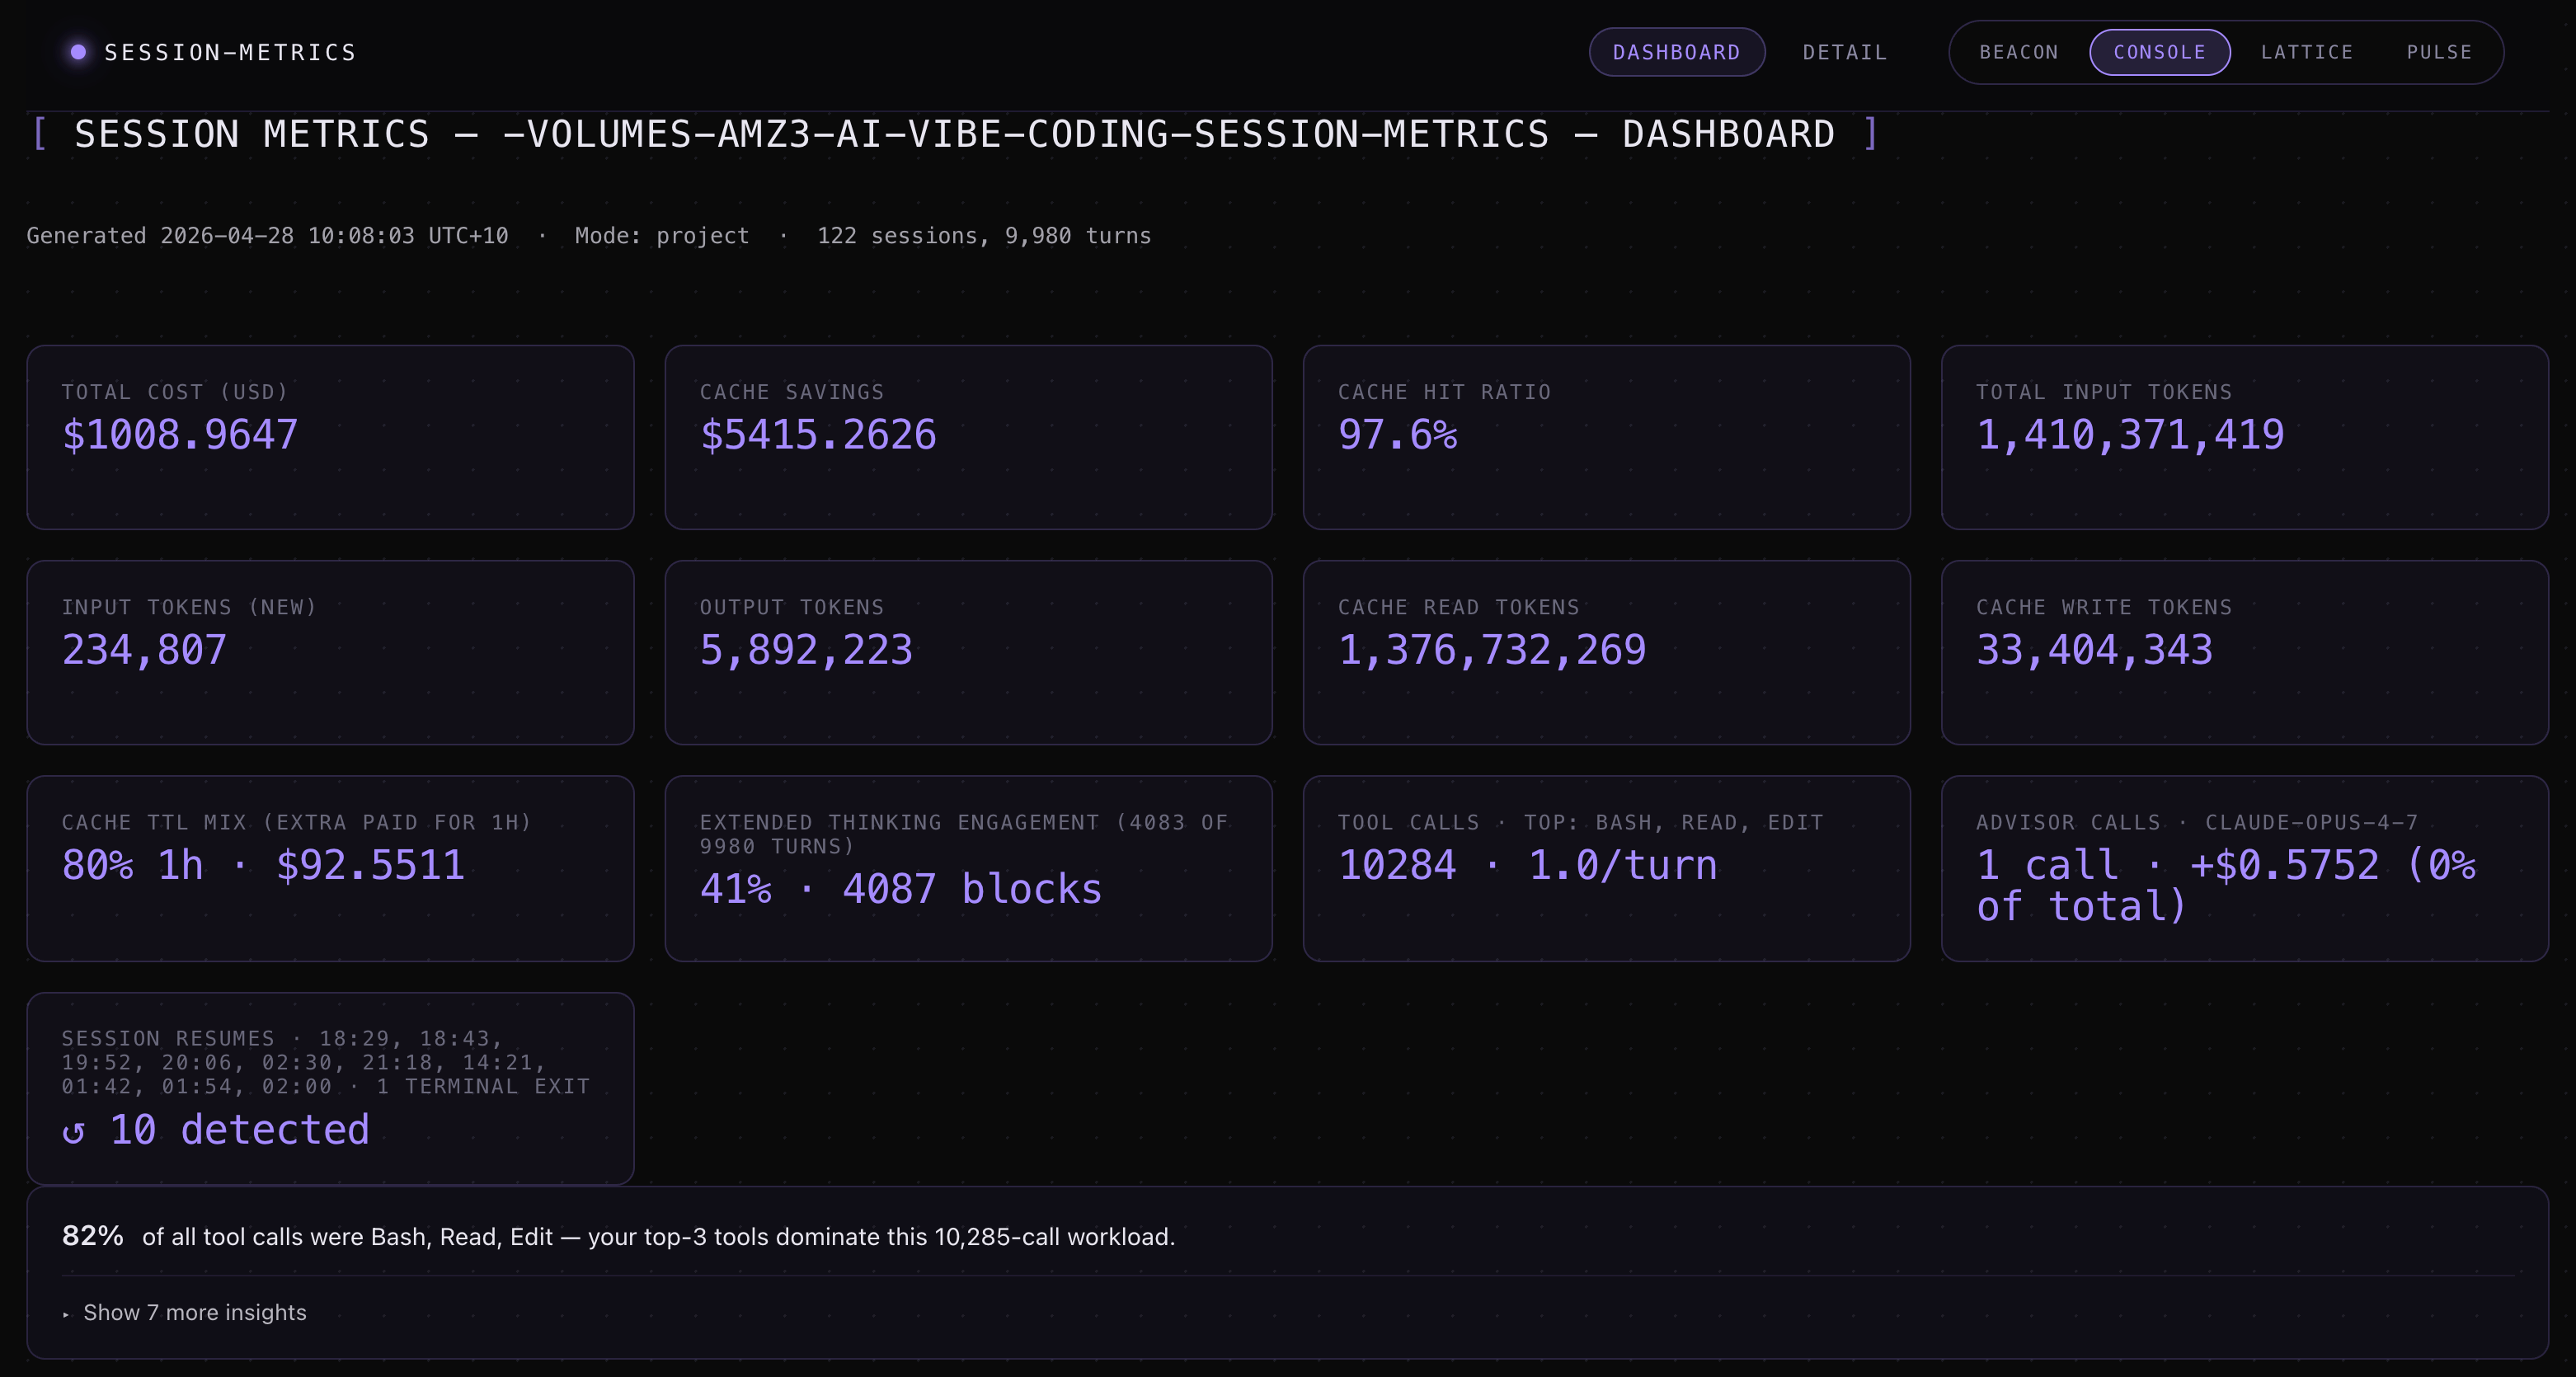
The dashboard page surfaces:
Summary cards — total cost, total tokens, cache hit %, session count, advisor calls.
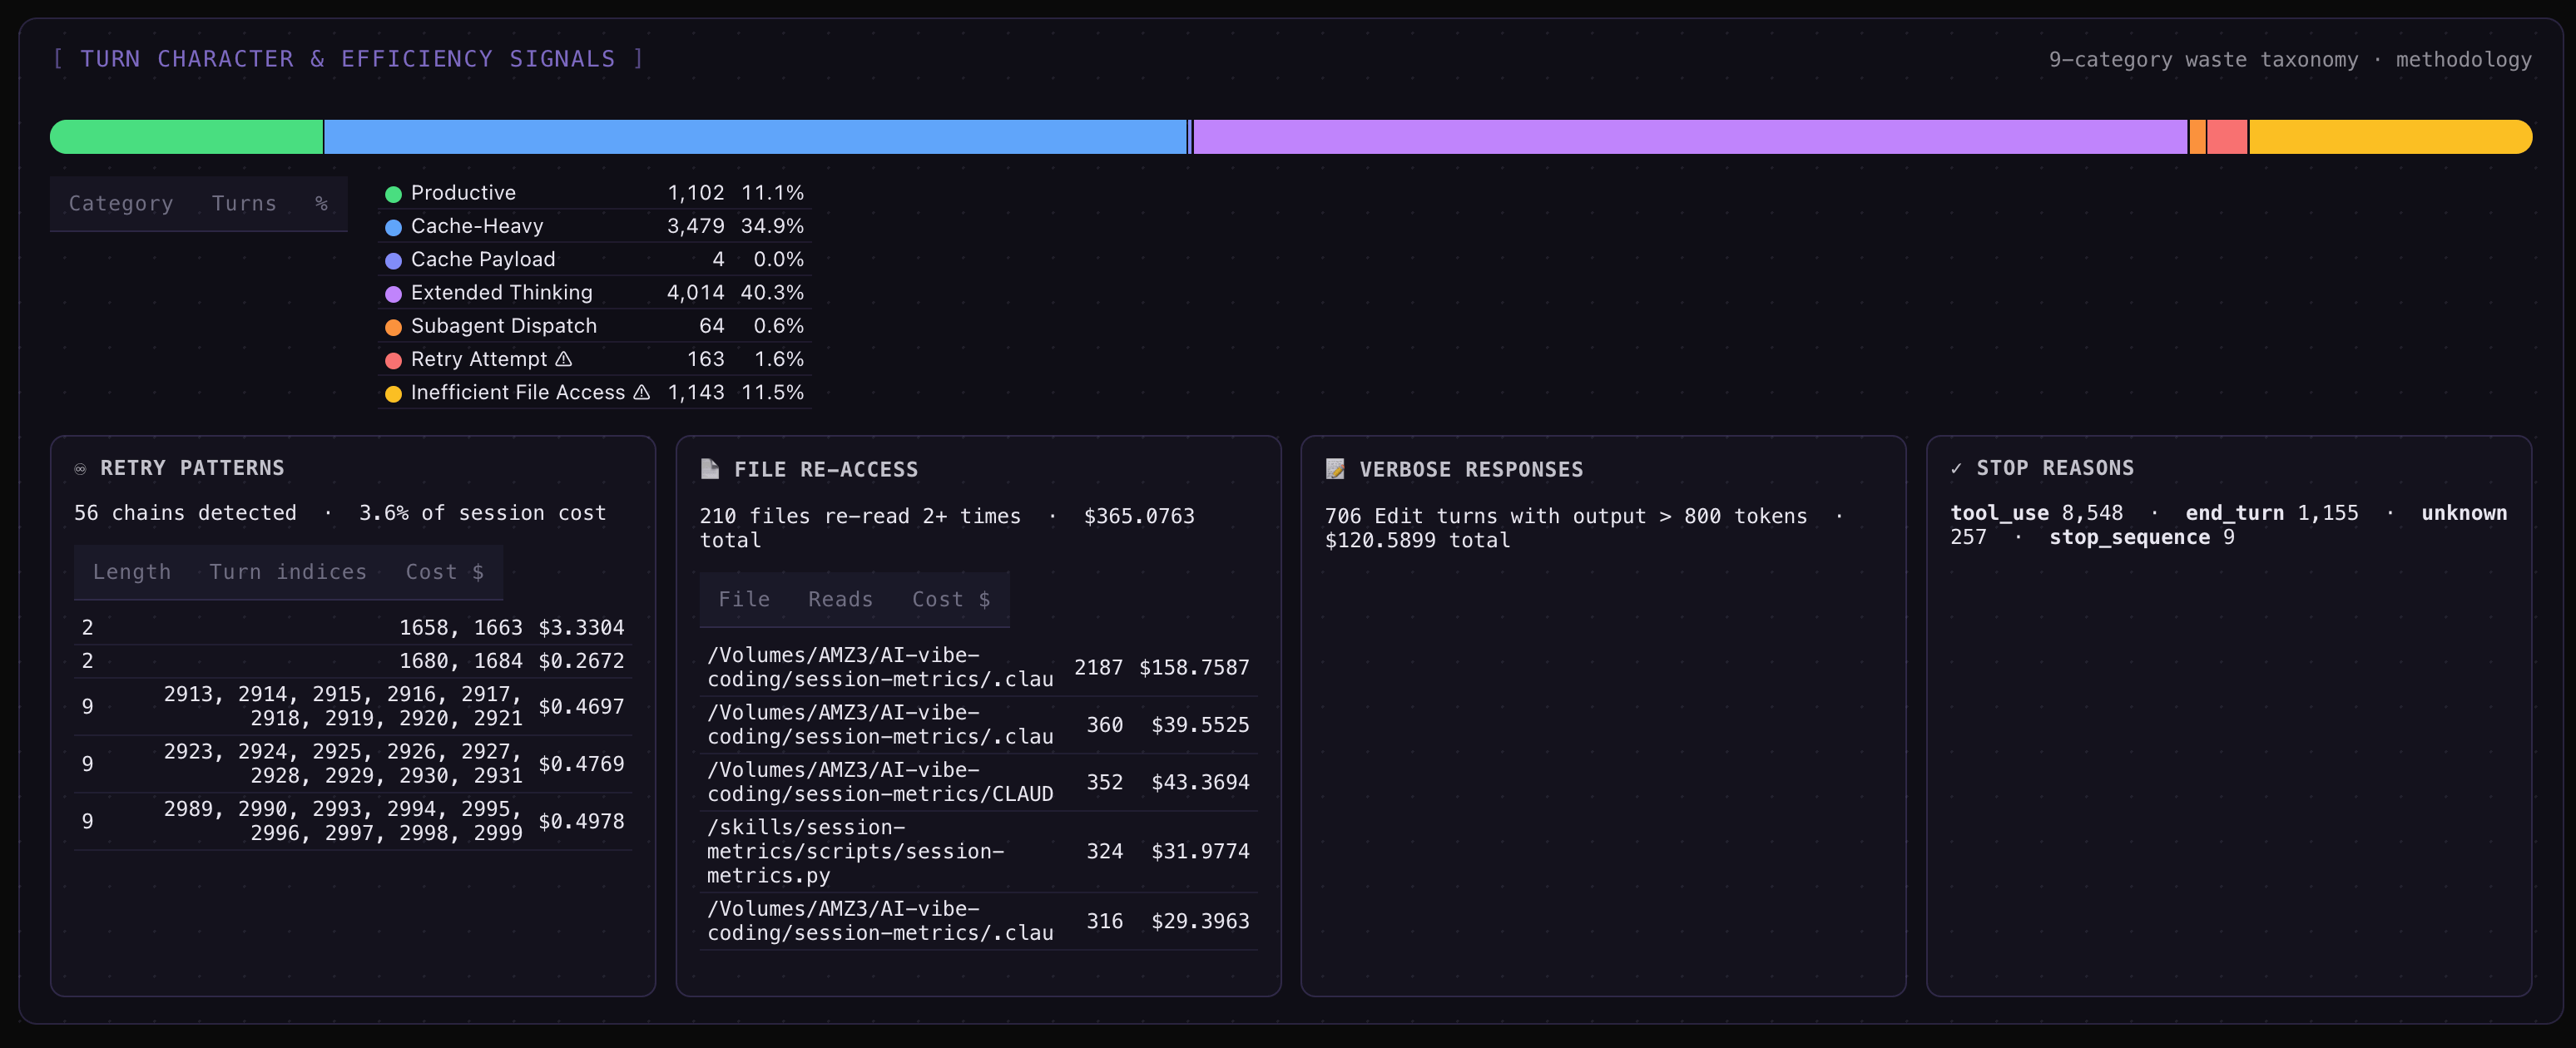
A 9-category turn-character stacked bar — every assistant turn classified as productive, retry_error, file_reread, oververbose_edit, dead_end, cache_payload, extended_thinking, subagent_dispatch, or normal. Drill-down cards underneath each category list the actual offending turns with file basenames, retry chains, and stop-reason distribution.
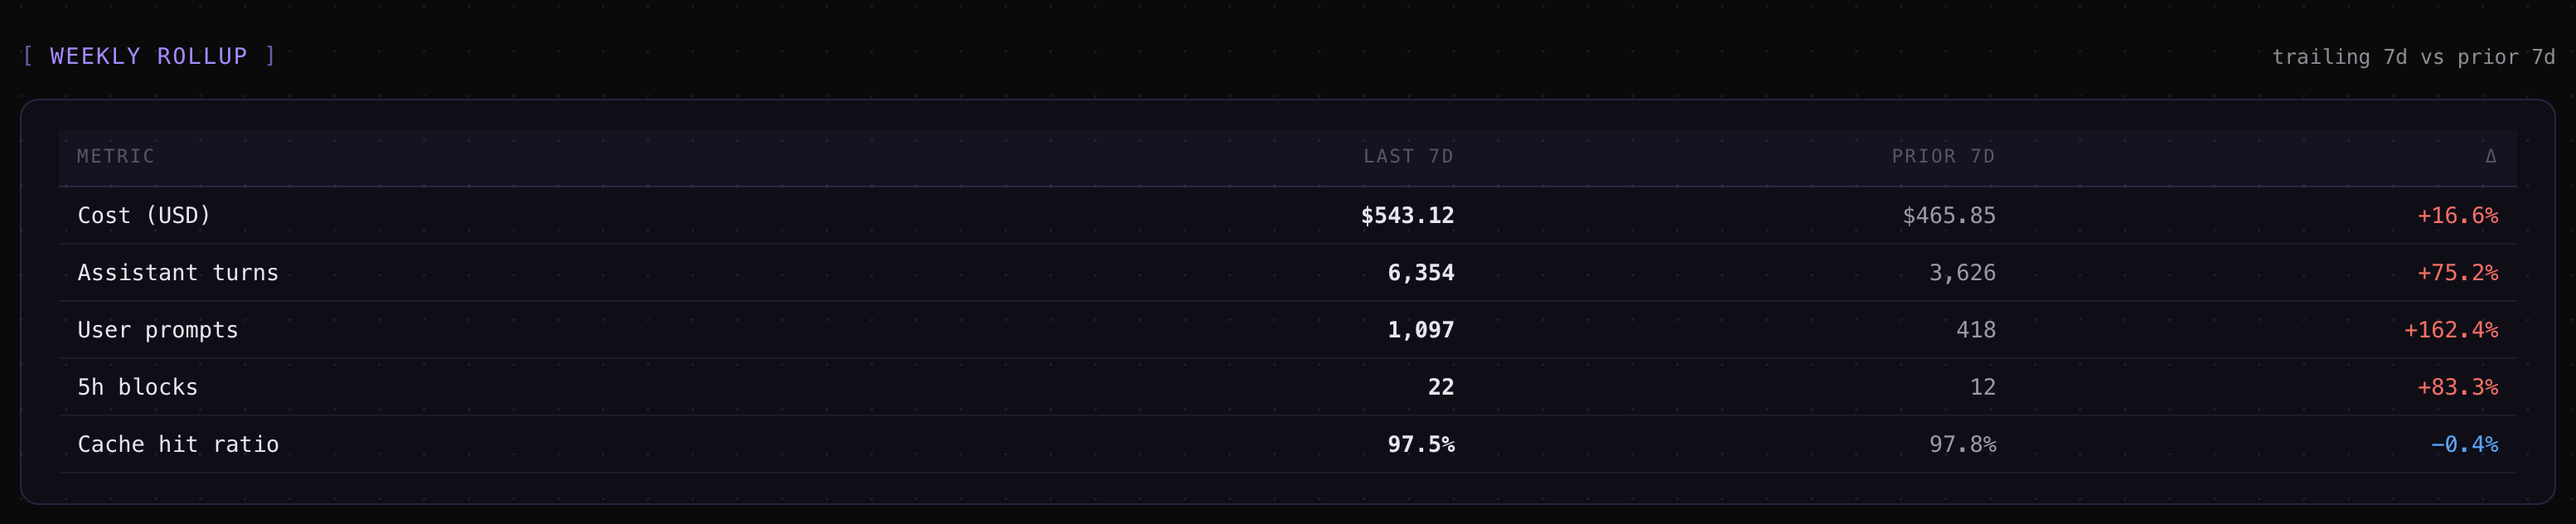
A weekly roll-up table — trailing 7 days vs. prior 7 days for cost, turns, prompts, blocks, and cache hit ratio, with percentage deltas.
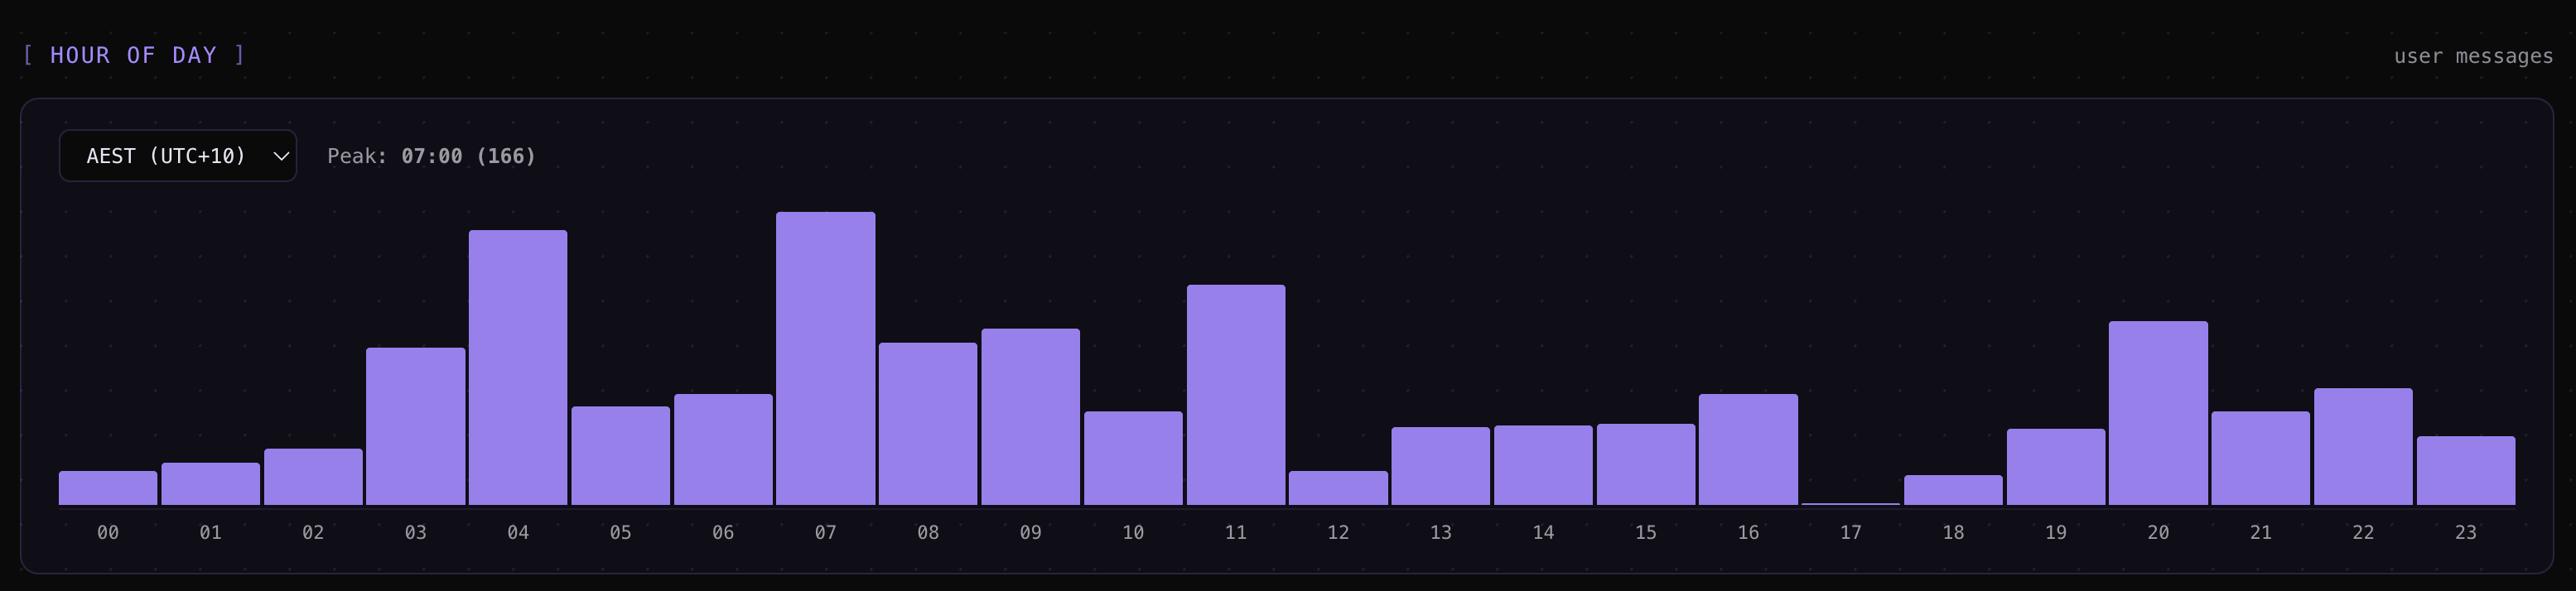
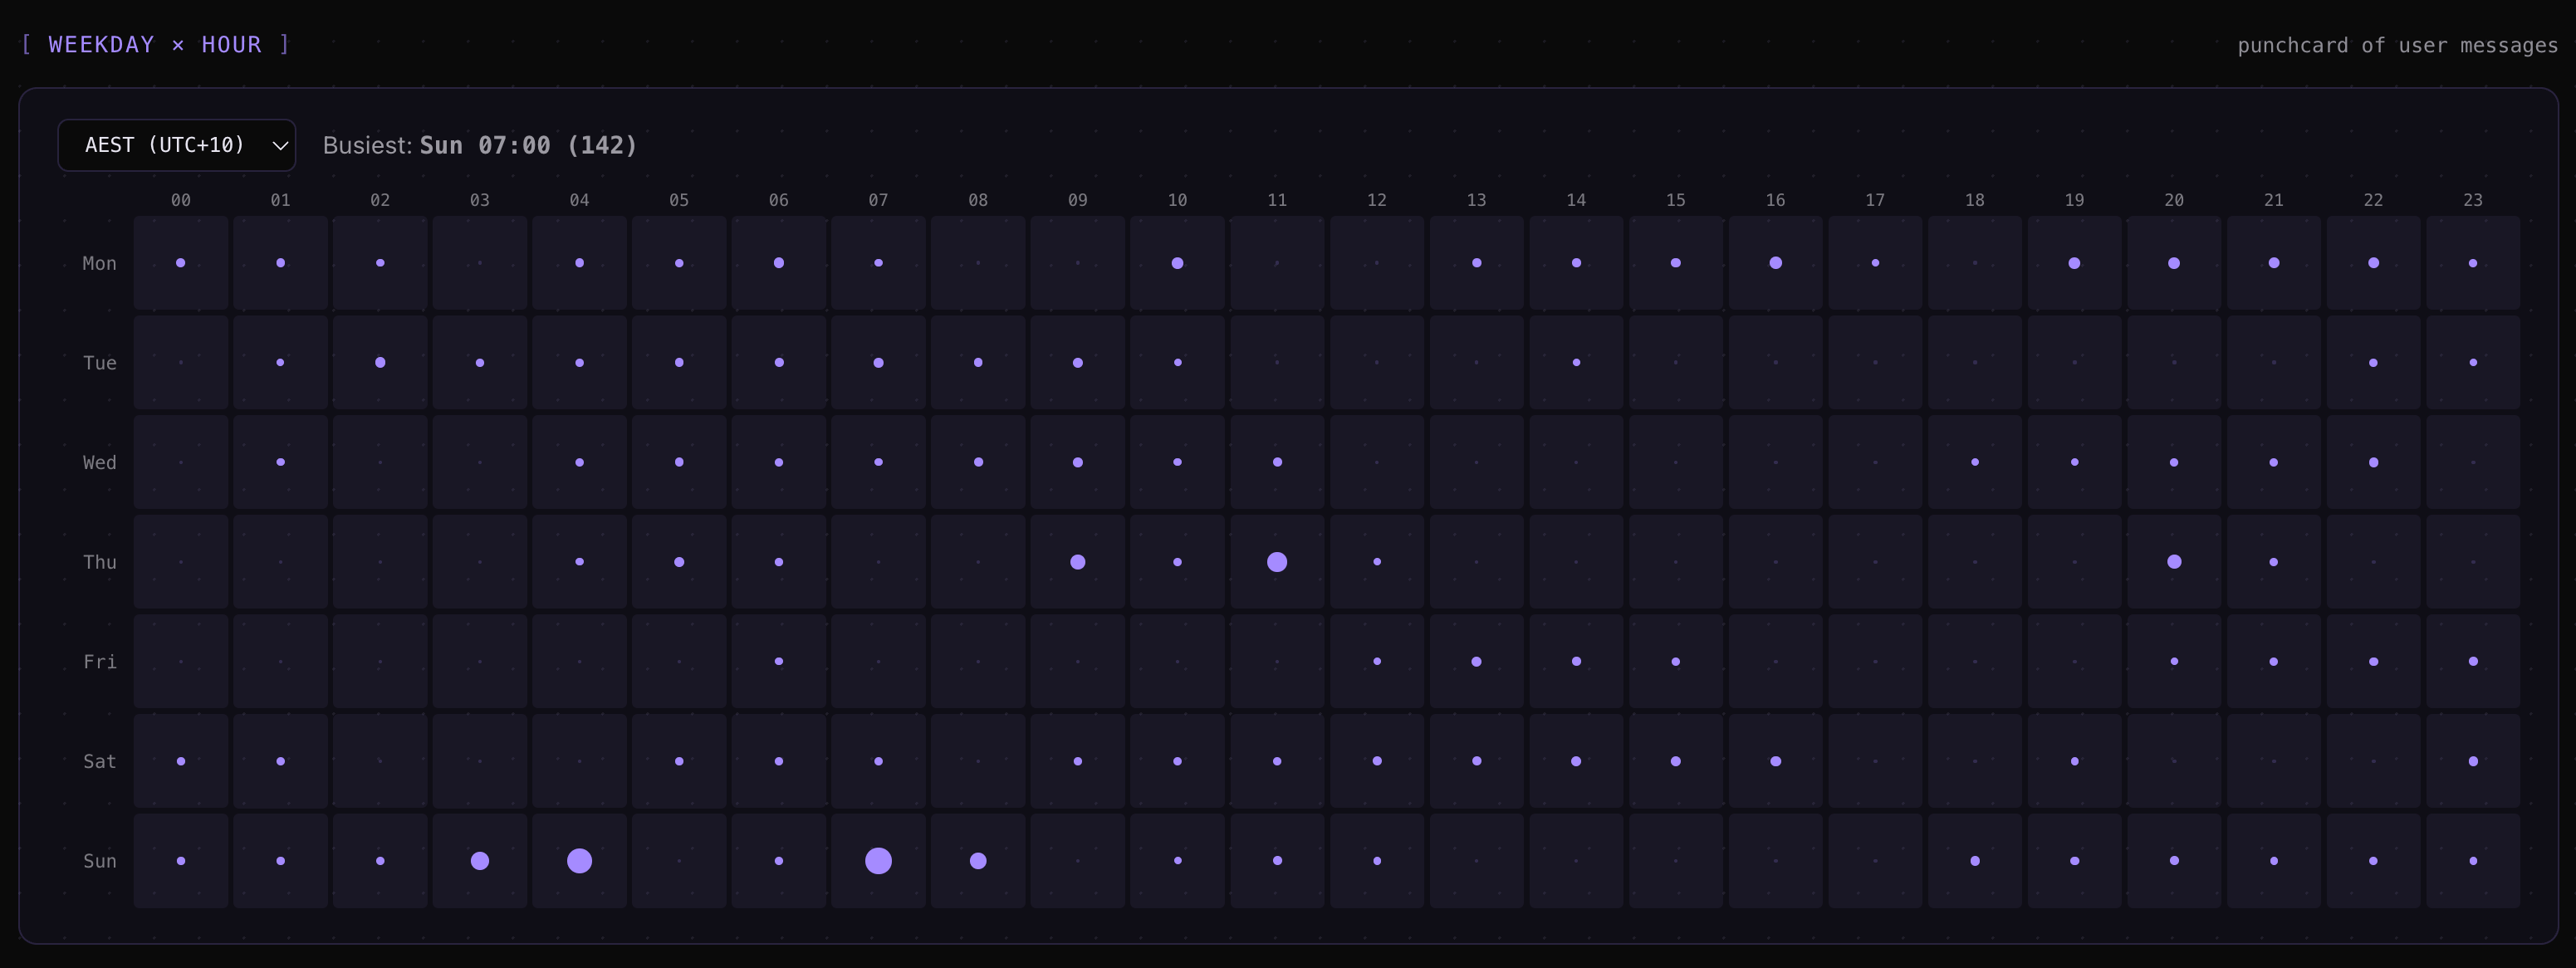
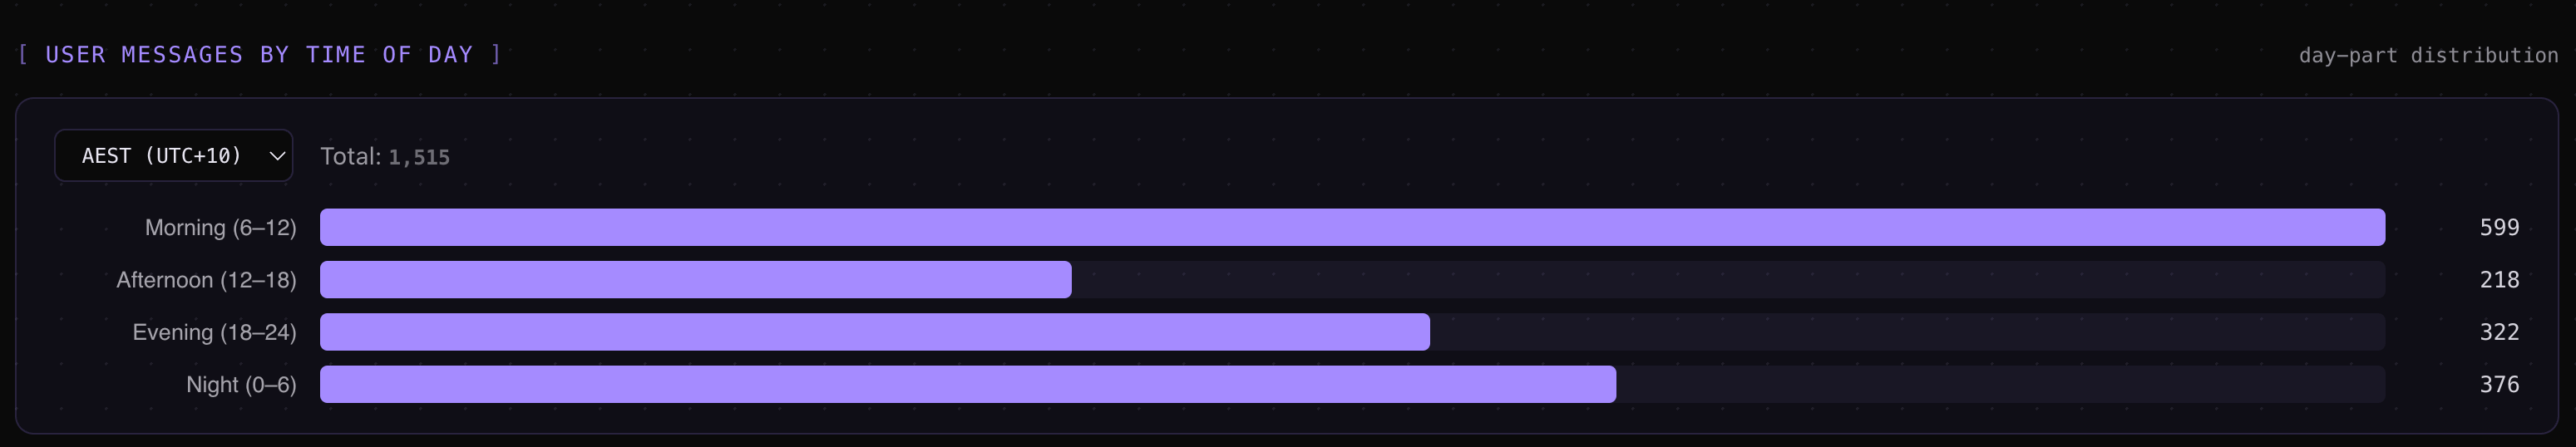
An hour-of-day + weekday × hour punchcard — a 24-bucket bar plus a 7×24 dot matrix in your local timezone, with optional
--peak-hoursoverlay for the community-reported off-peak window.
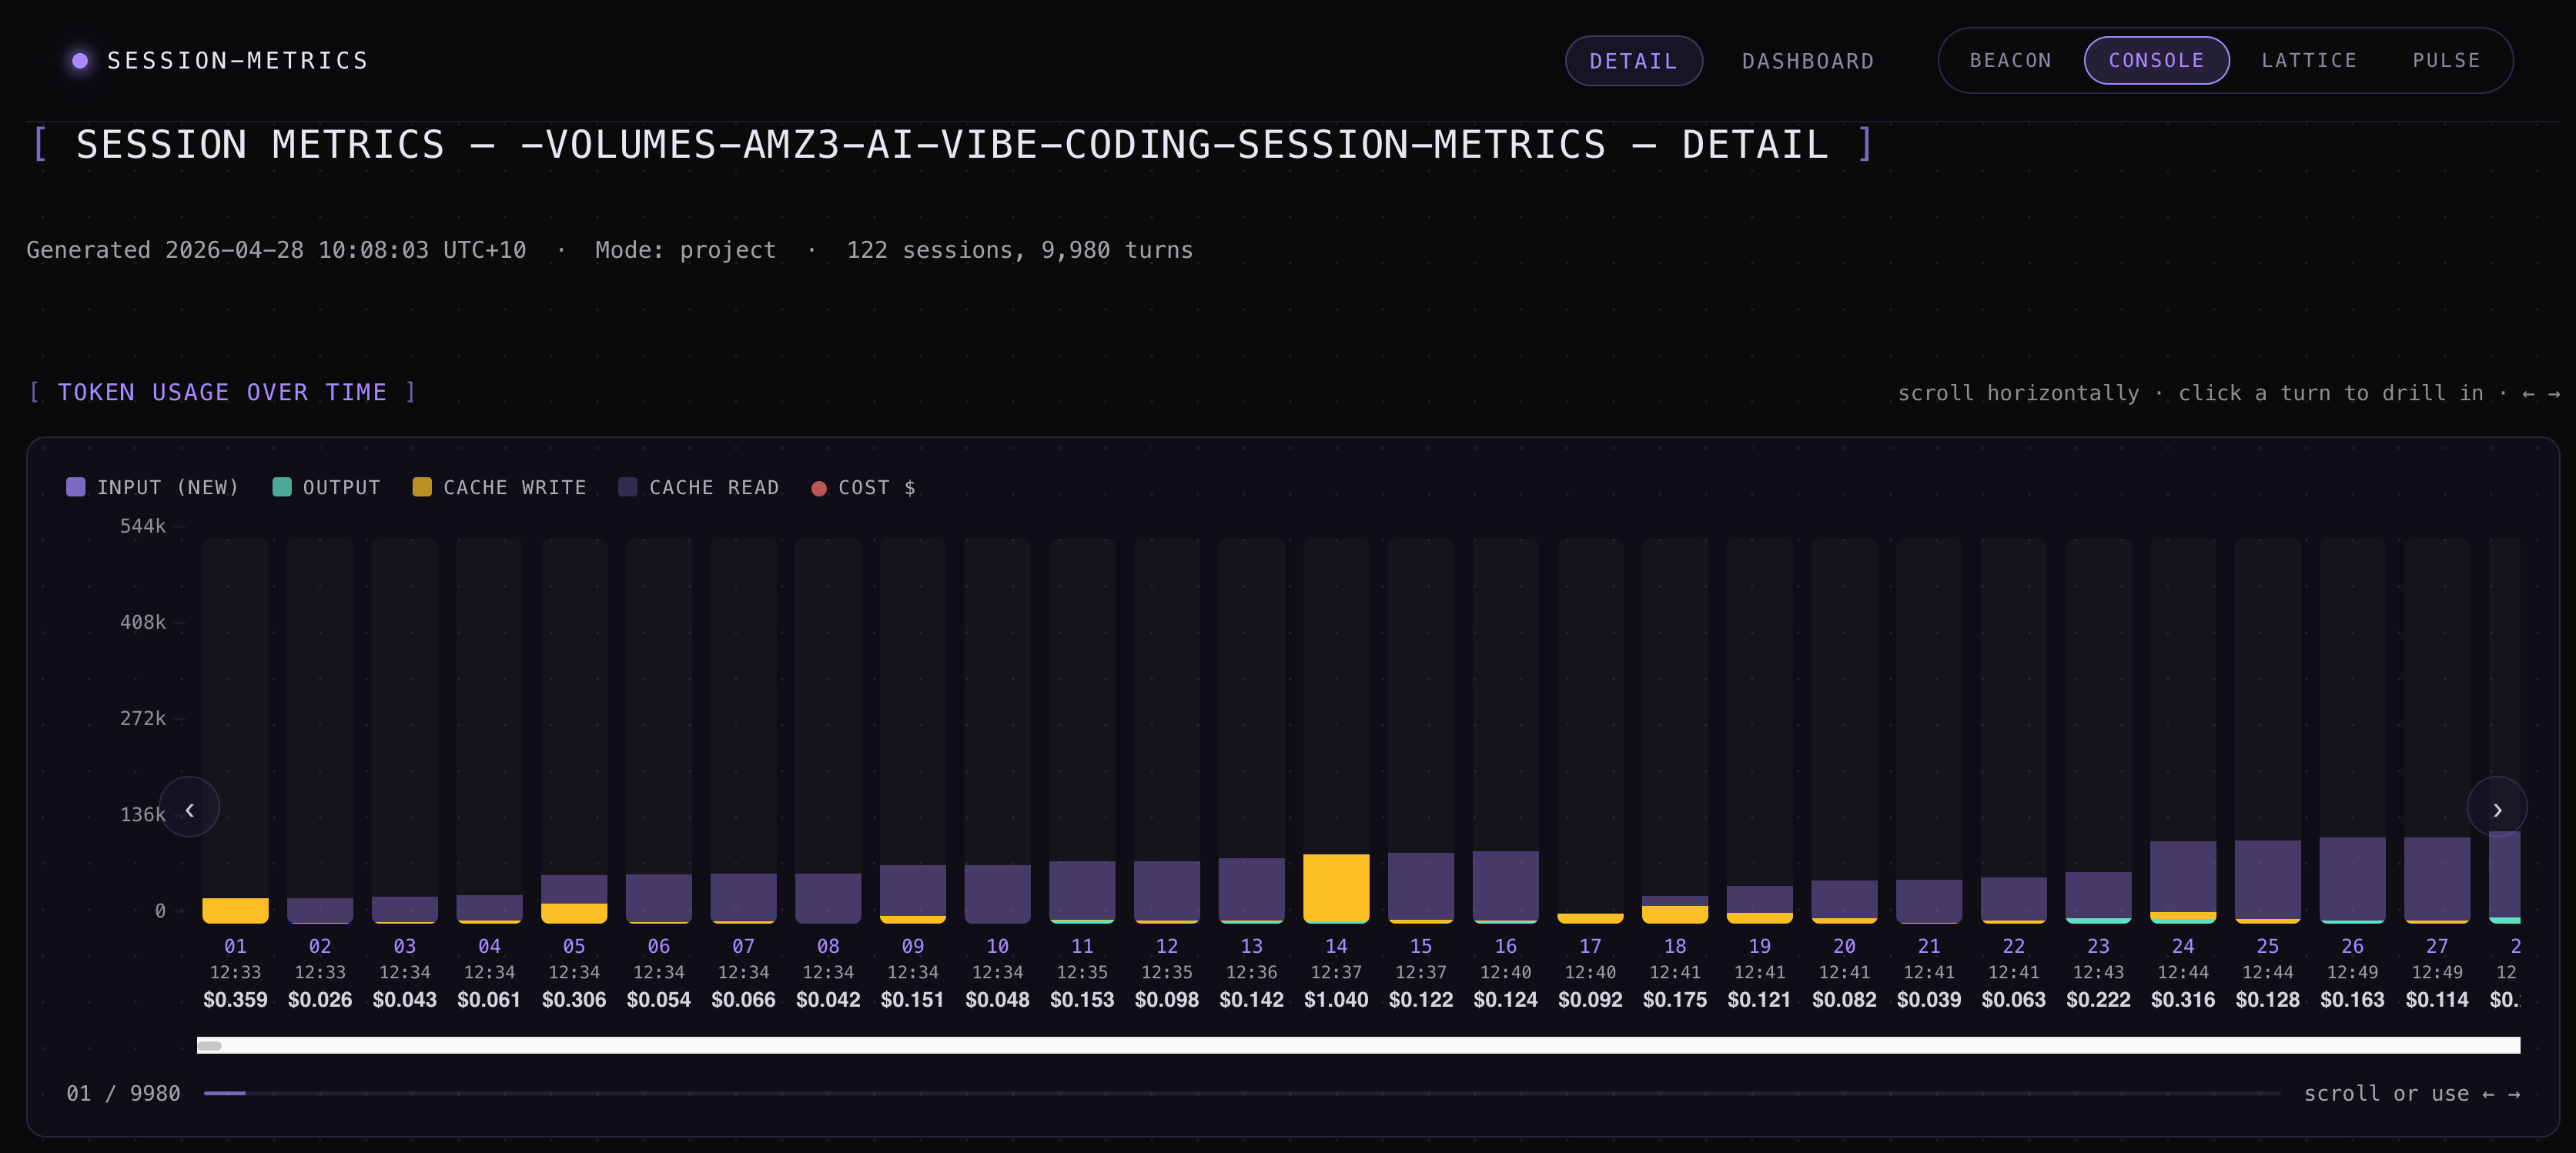
The detail page is the per-turn timeline. Four inline markers (added in v1.21) tell you what’s happening between turns at a glance:
▮ N min idle— a slate pill for idle gaps longer than a configurable threshold.⇄ Model: prev → cur— a cyan pill where the model changed mid-session.✂ truncated— a badge on any turn wherestop_reason="max_tokens".⚡— a cache-break marker on the exact turn where the cache failed.
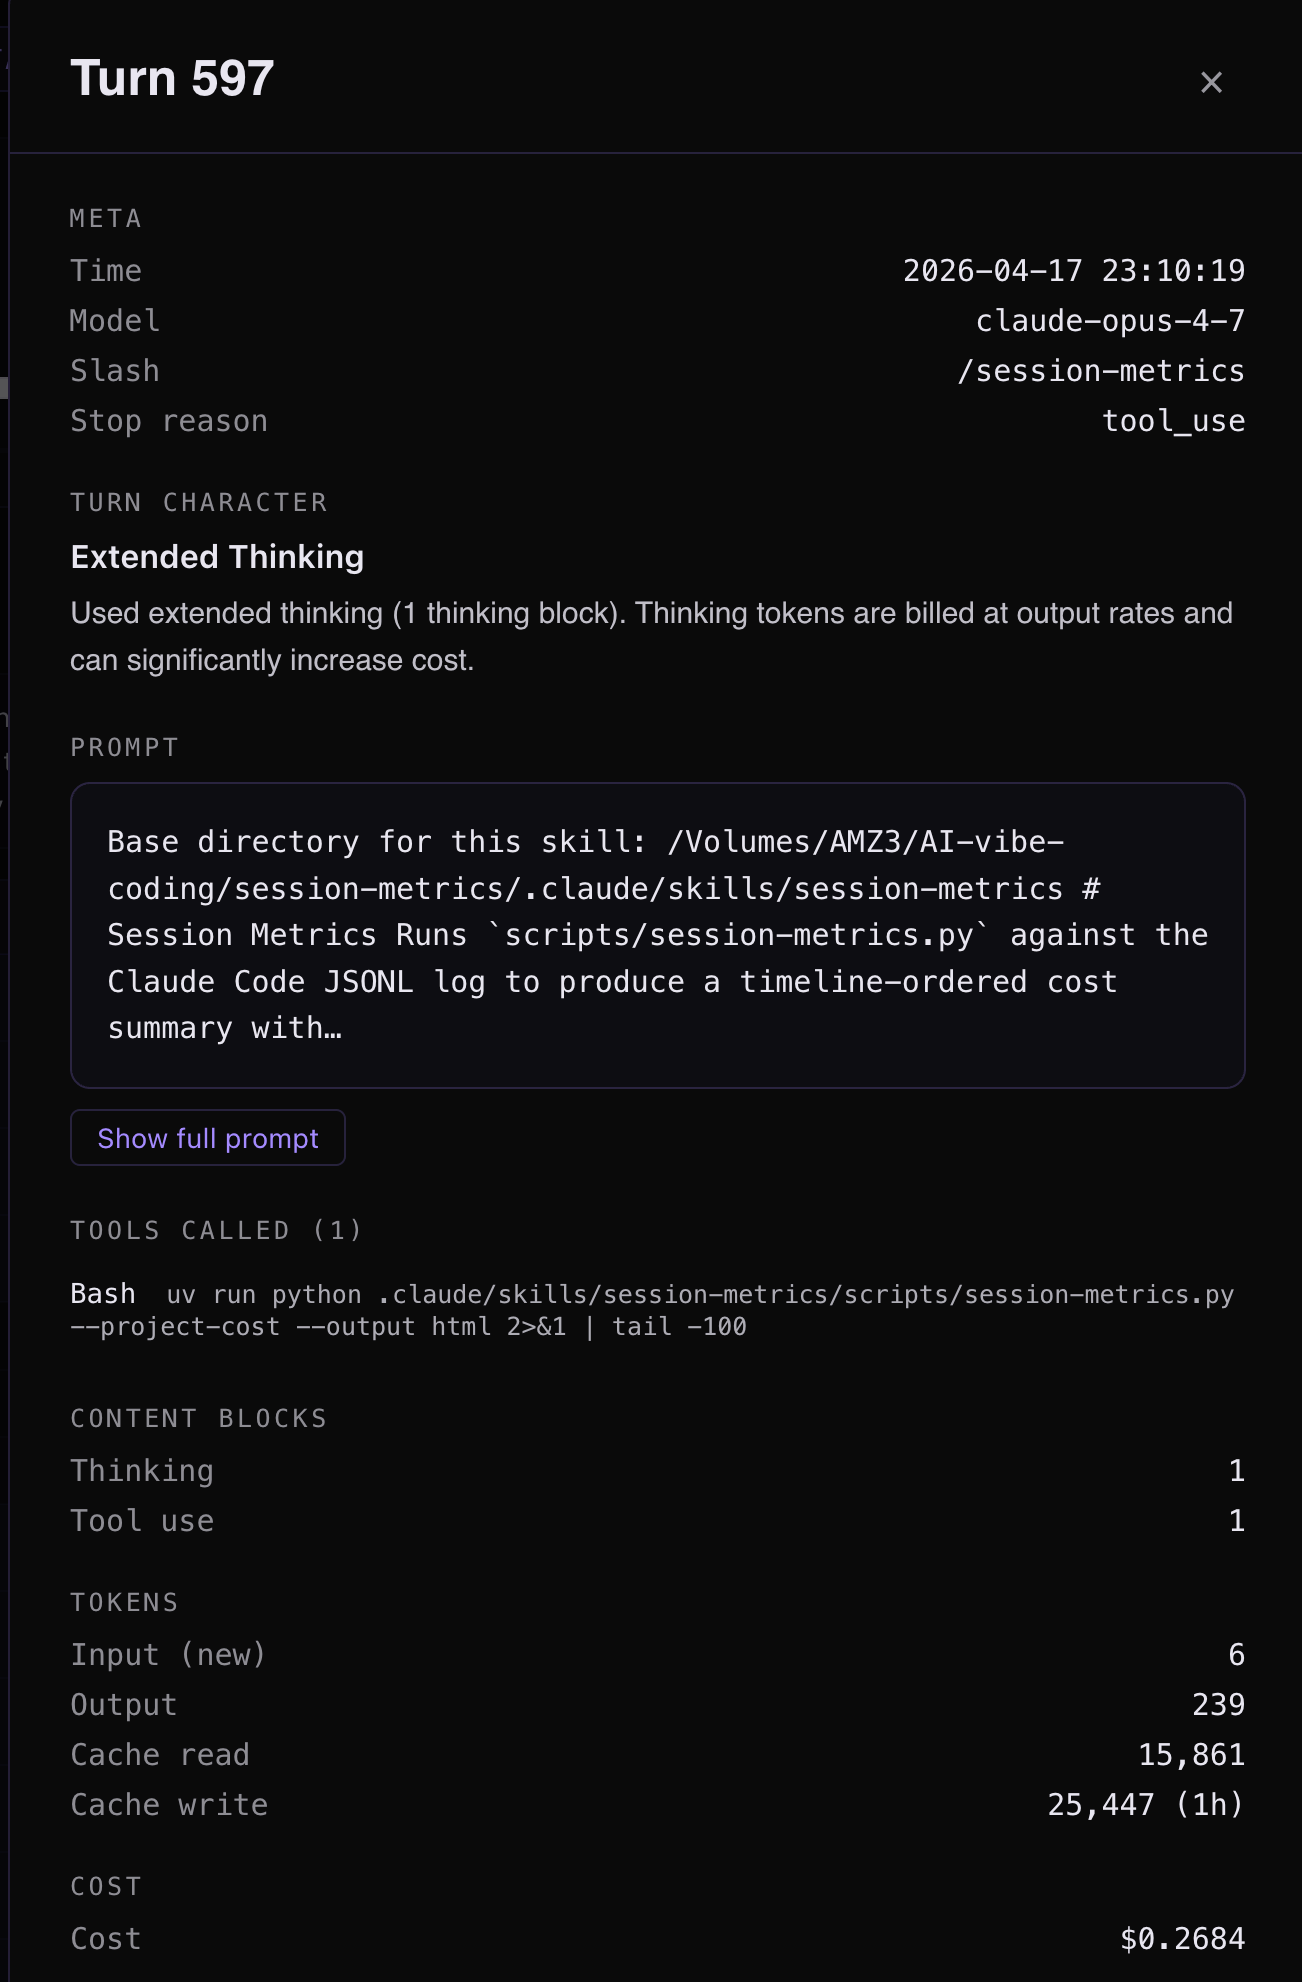
Click any turn row and a side drawer opens with the Turn Character section: the classification label, plus a colour-coded explanation built from real data (file basenames, cache %, content-block counts) — not a generic template.
Session Metrics Screenshots
One-command model benchmark
session-metrics --compare-run spawns two headless claude -p sessions against a canonical 10-prompt suite (or your own custom prompts) and renders an IFEval pass-rate table plus a cost ratio heatmap. It’s the fastest way to ask “is Opus 4.7 actually cheaper than 4.6 on my workload?” without writing benchmark scaffolding.
Defaults to claude-opus-4-6[1m] vs claude-opus-4-7[1m], but any pair of model IDs and effort anchors works.
Privacy & dependencies
Stdlib-only Python, runs via uv (which Claude Code already ships with). Zero network requests at runtime on every default code path — the chart library is vendored into the plugin and SHA-256 verified against a manifest before being inlined into the HTML, so reports work entirely offline. The one exception is --count-tokens-only, which calls Anthropic’s count_tokens endpoint with your own API key; it’s opt-in, separately billed, and explicitly not for subscription-plan users.
The plugin reads only files under ~/.claude/projects/ on your machine and writes reports under whatever output directory you choose. A parse cache lives at ~/.cache/session-metrics/parse/ (gzipped JSON keyed on file mtime); delete the directory or pass --no-cache to bypass.
The default chart renderer is Highcharts under its non-commercial-free licence. For commercial contexts, --chart-lib uplot and --chart-lib chartjs are MIT-licensed alternatives that ship in the same plugin payload.
A full privacy policy lives at the plugin’s PRIVACY.md.
Install
Inside Claude Code’s CLI:
/plugin marketplace add centminmod/claude-plugins
/plugin install session-metrics@centminmod
You get versioning and automatic updates. The plugin lands at ~/.claude/plugins/cache/centminmod/session-metrics/ and Claude Code picks it up on the next restart.
If you’d rather not use the marketplace, the plugin is also available via direct copy from centminmod/my-claude-code-setup.
What’s next on the marketplace
The marketplace is built to host more than one plugin. session-metrics is the first, but it’s not the last — the next few will get their own posts as they ship including my ai-image-creator and ai-video-creator skills. If you want to follow along, subscribe and the next launch lands in your inbox.
Further reading
Marketplace repo: github.com/centminmod/claude-plugins
Plugin source tree: plugins/session-metrics
Earlier on this Substack: