
I Built a Token Cost Analyzer Skill for Claude Code. Here’s What I Found
97.8% cache hit rate, $2,171 in savings. My session-metric skill revealed that mid-session model switch can result in a costly prompt token cache miss

In this post:
Opus 4.7 Updated Skill
The gap in my dashboard

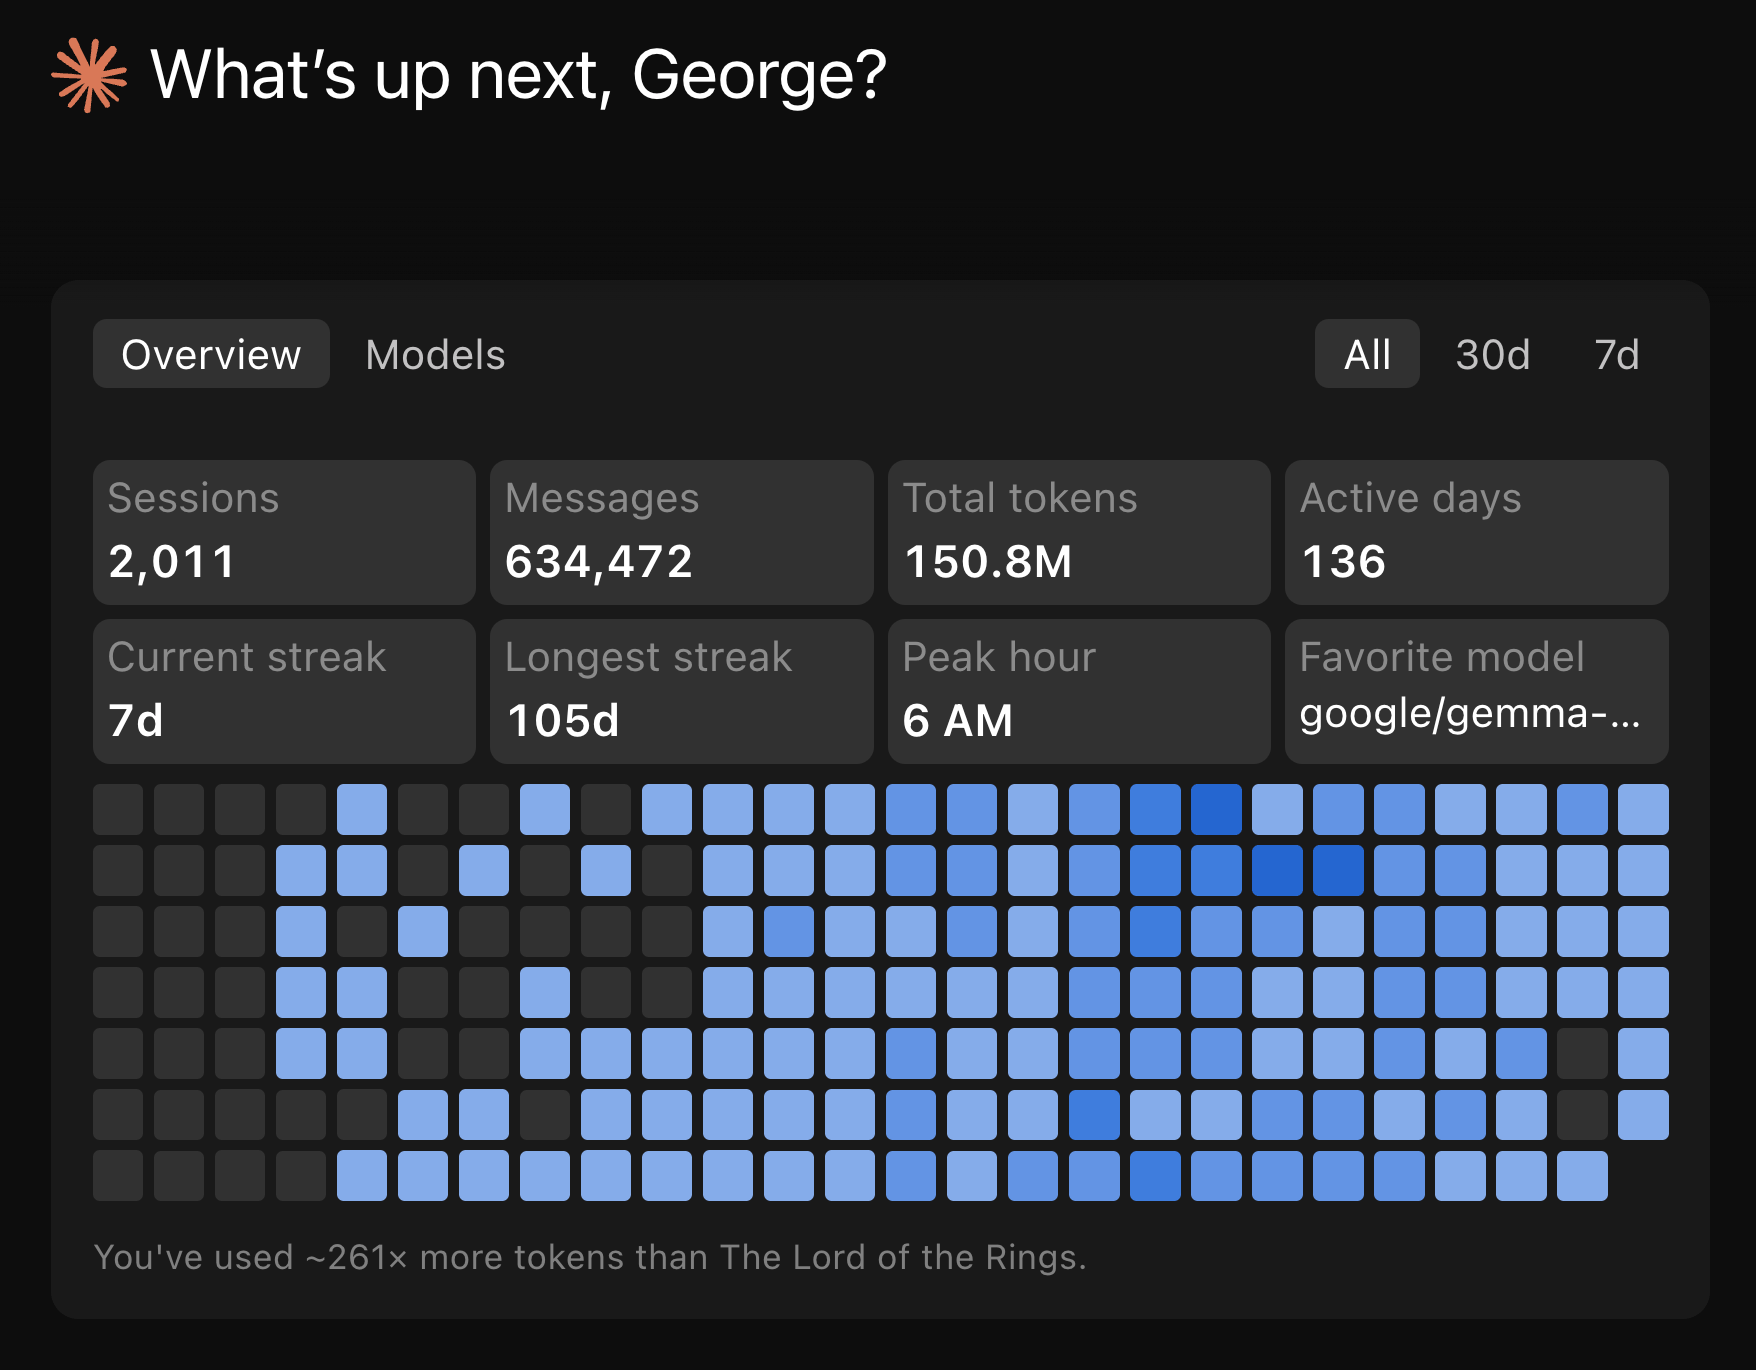
I’ve been building with Claude Code daily for weeks. Videos, MCP servers, skills, GUI tools. I already track costs through Claude’s OpenTelemetry integration piped into Grafana. The aggregate picture looked good: 97.8% cache hit ratio, $2,171 in estimated savings across 44 sessions.
But aggregates only tell you what happened in total across all Claude Code projects. They don’t tell you what happened at turn 19 (chat response) within an individual Claude Code chat session.
Cost forecasts, cache hit rates, model efficiency, token usage over time. All useful at the macro level. But none of it shows me why one response costs $0.92 and the next costs $0.03, or where the cache breaks inside a conversation, or what happens when I switch from Opus to Sonnet mid-session.

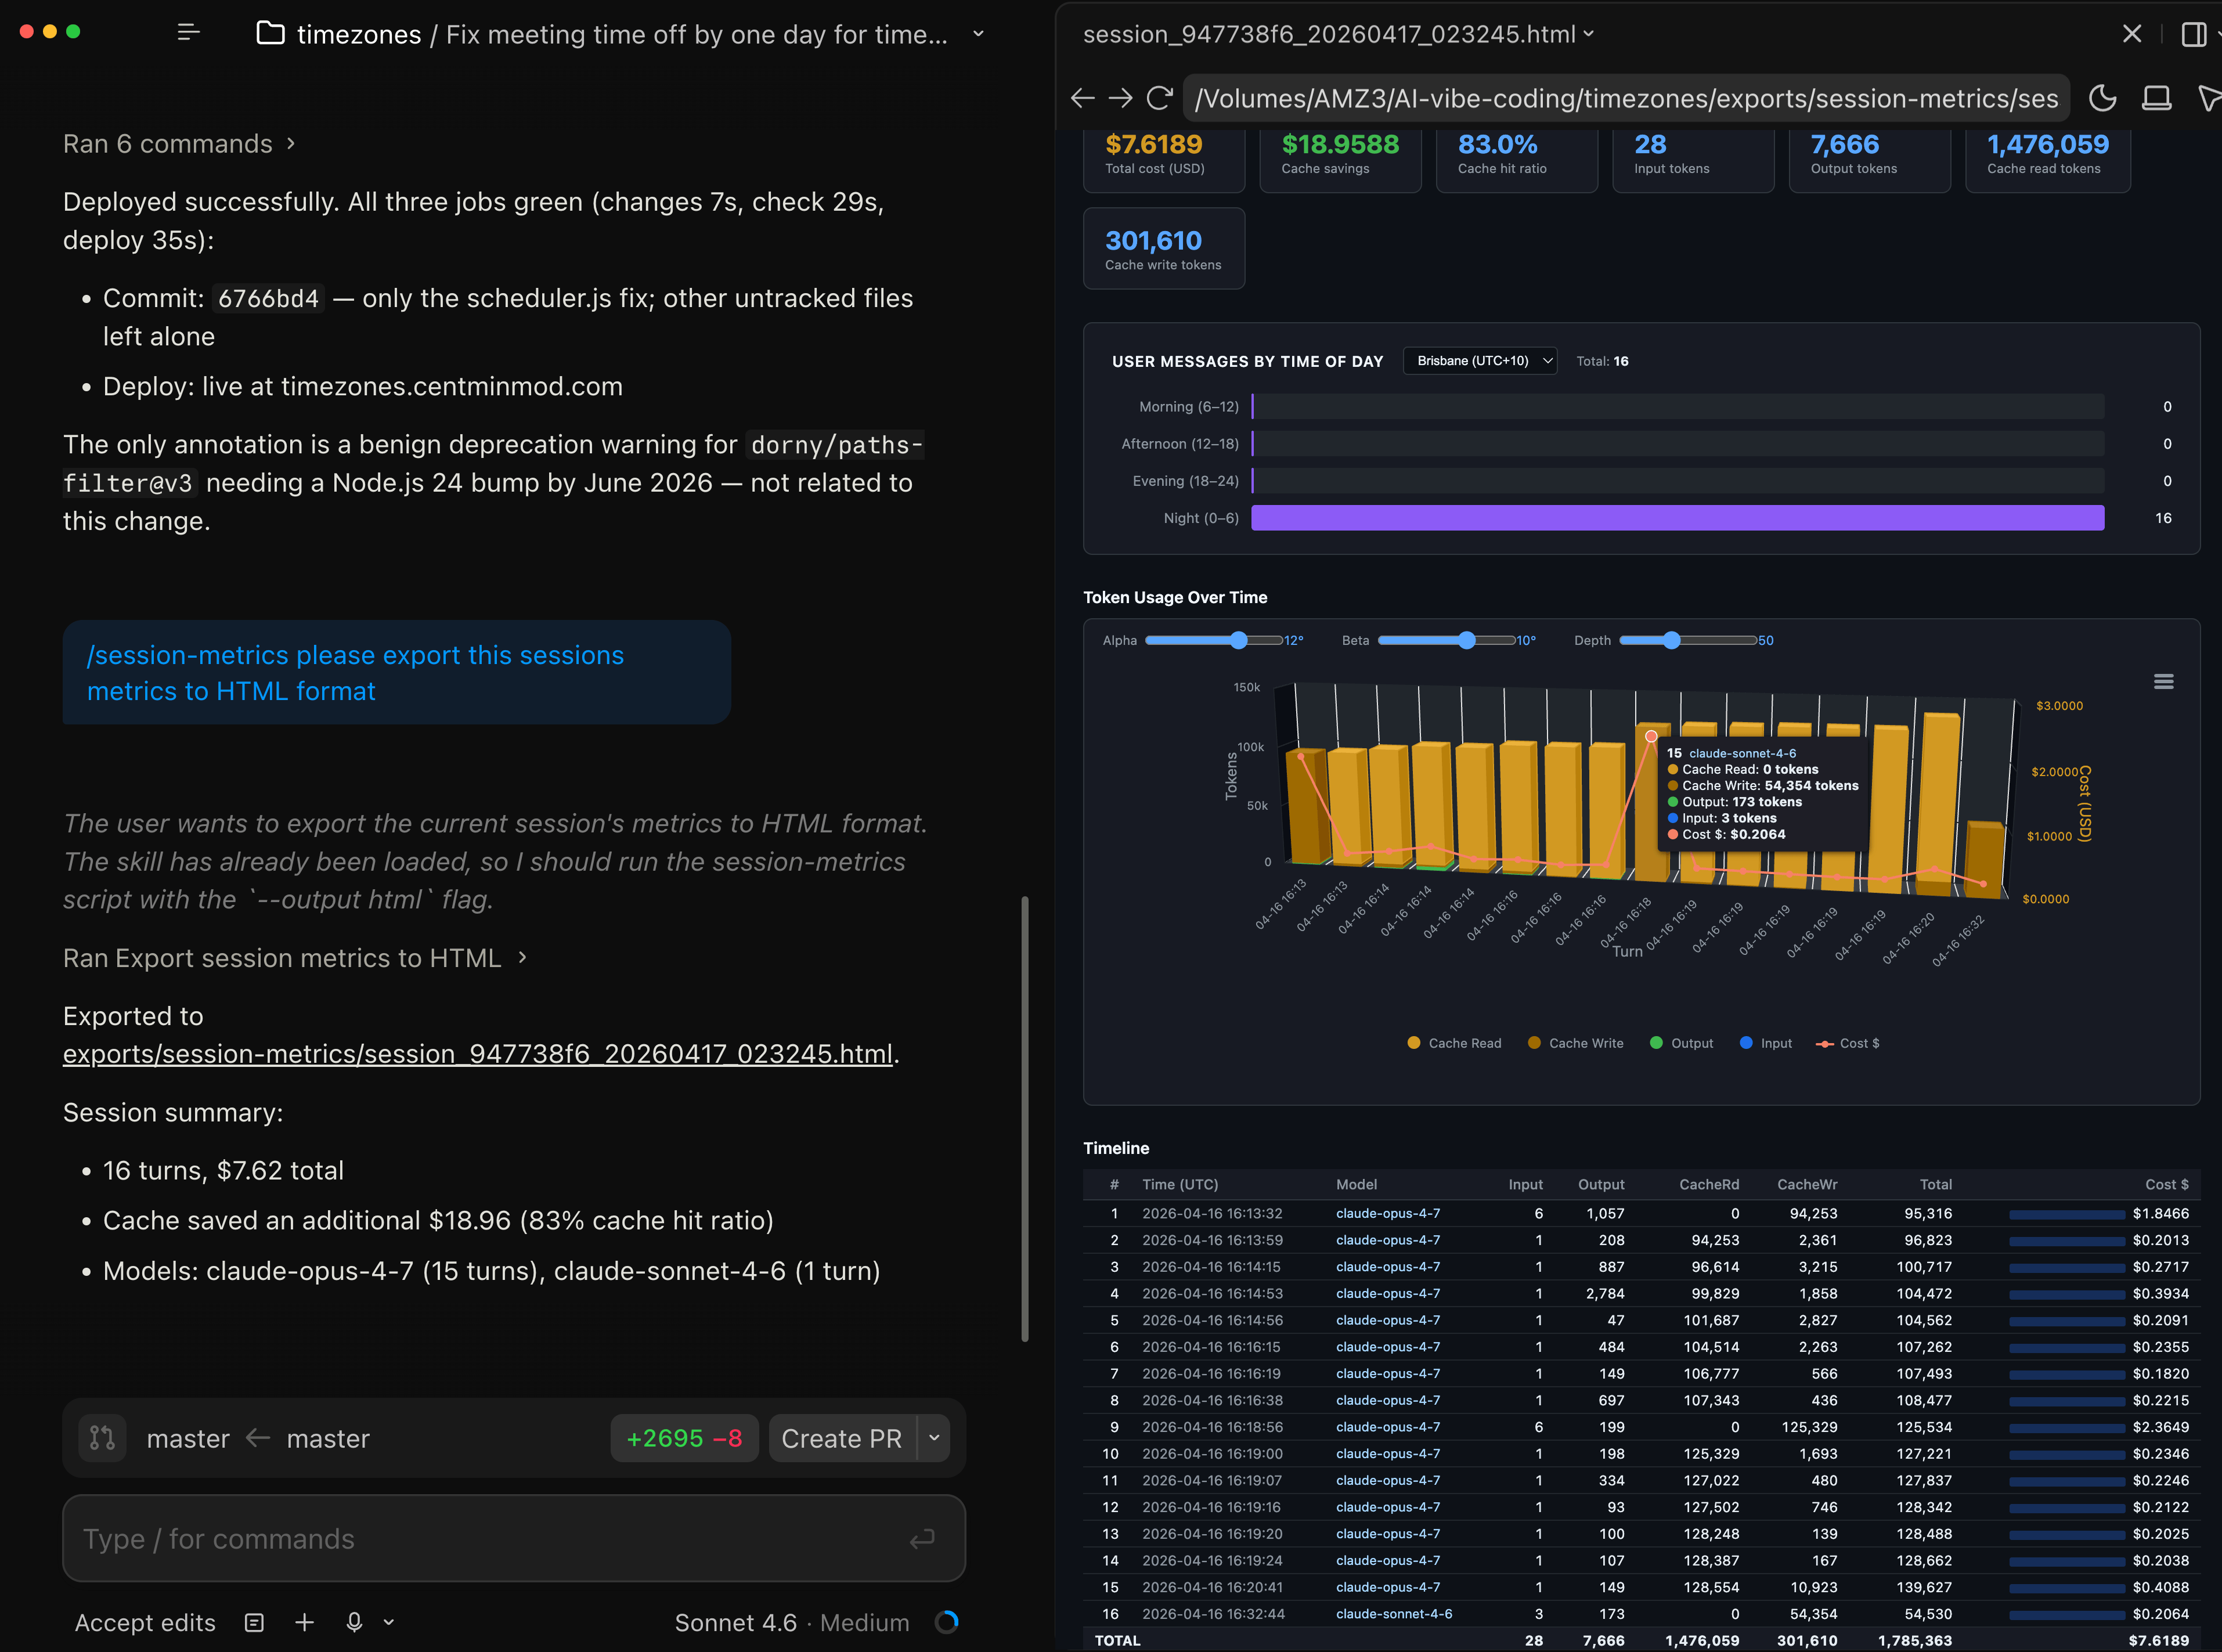
I wanted per-turn visibility at the individual Claude Code chat session level. So I built a Claude Code skill, sessions-metric that reads Claude Code’s raw conversation logs and breaks down every response at the project and project session level. Update: the session-metric skill is now publicly available via my Claude Code plugin marketplace.
There are other popular usage tools, ccusage, ccburn, Claude-Code-Usage-Monitor, codeburn etc, but none would also operate at the Claude Code individual chat session level.
Why this matters right now
This isn’t just my problem. If you use Claude Code, you’ve probably noticed the rate limit complaints. They’re everywhere. Anthropic has acknowledged that “people are hitting usage limits way faster than expected.” Some users report that sessions meant to last hours burn out in minutes. In March 2026, a GitHub issue documented abnormal session limit drain across Claude Max subscribers, and Anthropic confirmed they were “intentionally adjusting 5-hour session limits to manage growing demand.”
Not all of this is user error. Community investigation on GitHub (#41930) identified at least four overlapping root causes hitting simultaneously: intentional peak-hour throttling (confirmed by Anthropic on March 26), two prompt-caching bugs silently inflating token costs 10-20x, session-resume bugs triggering full context reprocessing, and the expiration of a 2x off-peak usage promotion on March 28. Anthropic has shipped fixes for some of these, and Boris Cherny said they’re investigating a 400K default context window (down from 1M) to reduce cache miss costs.
But even after Anthropic fixes the bugs on their end, the user-controllable side still matters. Most developers have zero visibility into what’s happening with their tokens per response. You see totals. You don’t see the moment a mid-session model switch nukes your cache and silently re-writes 92,000 tokens (see below for details). To understand why that matters, you need to understand how caching works.
A quick cache primer
Every Claude Code message sends the full conversation context to the API: system prompt, CLAUDE.md files, tool definitions, and every prior message. Prompt caching avoids reprocessing this prefix each time. Cache reads cost 0.1x the base input price; cache writes cost 1.25x. For Opus 4.6, that’s $1.50 per million tokens versus $15.00 for uncached input. A 10x difference. This is why my 97.8% cache hit ratio translated to $2,171 in estimated savings across 44 sessions.
The catch: caches expire. Max subscribers get a 1-hour TTL; Pro and API key users get 5 minutes. In early March 2026, the 1-hour TTL appeared to regress to 5 minutes, contributing to the wave of “my quota is draining too fast” complaints. There’s also a subtle gotcha: disabling telemetry also disables the 1-hour TTL.
If you take a break longer than your TTL, the cache is gone. Claude Code creator Boris Cherny noted that “prompt cache misses when using 1M token context window are expensive… if you leave your computer for over an hour then continue a stale session, it’s often a full cache miss.” Editing your system prompt or CLAUDE.md mid-session also invalidates the cache from that point forward.
This is where per-turn timestamps become useful. Each turn in the session metrics has a UTC timestamp, so you can spot idle gaps and correlate them with cache write spikes. A 13-minute gap on a Pro plan means a guaranteed full cache miss. On Max with the 1-hour TTL, you’d still be covered. The data lets you see exactly where idle-time cache misses are costing you.
The build
The whole thing came together in three sessions on a single day. Seven commits, 1,423 lines of Python, no external dependencies. It runs entirely on the standard library with uv run python. Sessions 1 and 2 used Sonnet 4.6. Session 3 used Opus 4.6 for the more complex time-of-day logic.
Session 1: “Where are the tokens going?”
It started with a simple question: can I see what each response actually costs?
Claude Code stores every conversation as a JSONL file at ~/.claude/projects/<slug>/<session-uuid>.jsonl. Each line is a JSON object with the full token usage breakdown. The data was already there, sitting on disk. Some tools were built to read and surface this information.

I told Claude to build a script that reads these logs and produces a per-turn cost table. Seventy-three minutes later, I had a working tool: 971 lines of Python, five export formats (text, JSON, CSV, Markdown, HTML), and an interactive dark-themed HTML report with 3D stacked column charts.
The first insight came immediately. Turn 1 of a session costs the most (cache write for the entire context), and every subsequent turn rides the cache for a fraction of the price. Some responses cost $0.03 (a quick Sonnet answer). Others cost $0.92 (a dense Opus planning turn). The numbers were right there, per row, with timestamps.
Session 2: “Why is the report so slow?”
With the tool working, I generated a project-wide report: 44 sessions, 3,031 turns. Then I opened it in Chrome and waited. And waited.
The problem: 49 chart panels, each with its own copy of the Highcharts config. About 336 KB of duplicated JavaScript plus 2,900 table rows rendering on page load.
Twenty-two minutes and three fixes later: deduplicated the chart JS into a single shared data blob (336 KB down to 173 KB), added lazy rendering so charts only initialize when you scroll to them, and collapsed the 2,900 turn rows behind clickable session headers. The page felt instant.

Session 3: “Am I coding during peak hours?”
This was the question that changed my behavior. Claude Code has known peak hours: weekdays 5 to 11 AM Pacific Time. During peak, rate limits tighten. If I could see when I actually use Claude relative to those windows, I could decide whether to shift my schedule.

Before writing code, I had Claude plan the implementation three times. This three-pass approach (build, optimize, self-reflect) caught a JavaScript modulo sign bug before a single line was written: JS preserves sign on % unlike Python, so negative timezone offsets produce wrong buckets. Catching it in planning instead of debugging saved real time.
The result: an interactive heatmap with a timezone dropdown that re-buckets your usage client-side. My numbers showed 1,709 morning messages, 1,235 afternoon, 795 evening, 0 at night. I’d already shifted my heavy coding sessions to off-peak hours before building this tool, so the heatmap confirmed the shift was working.

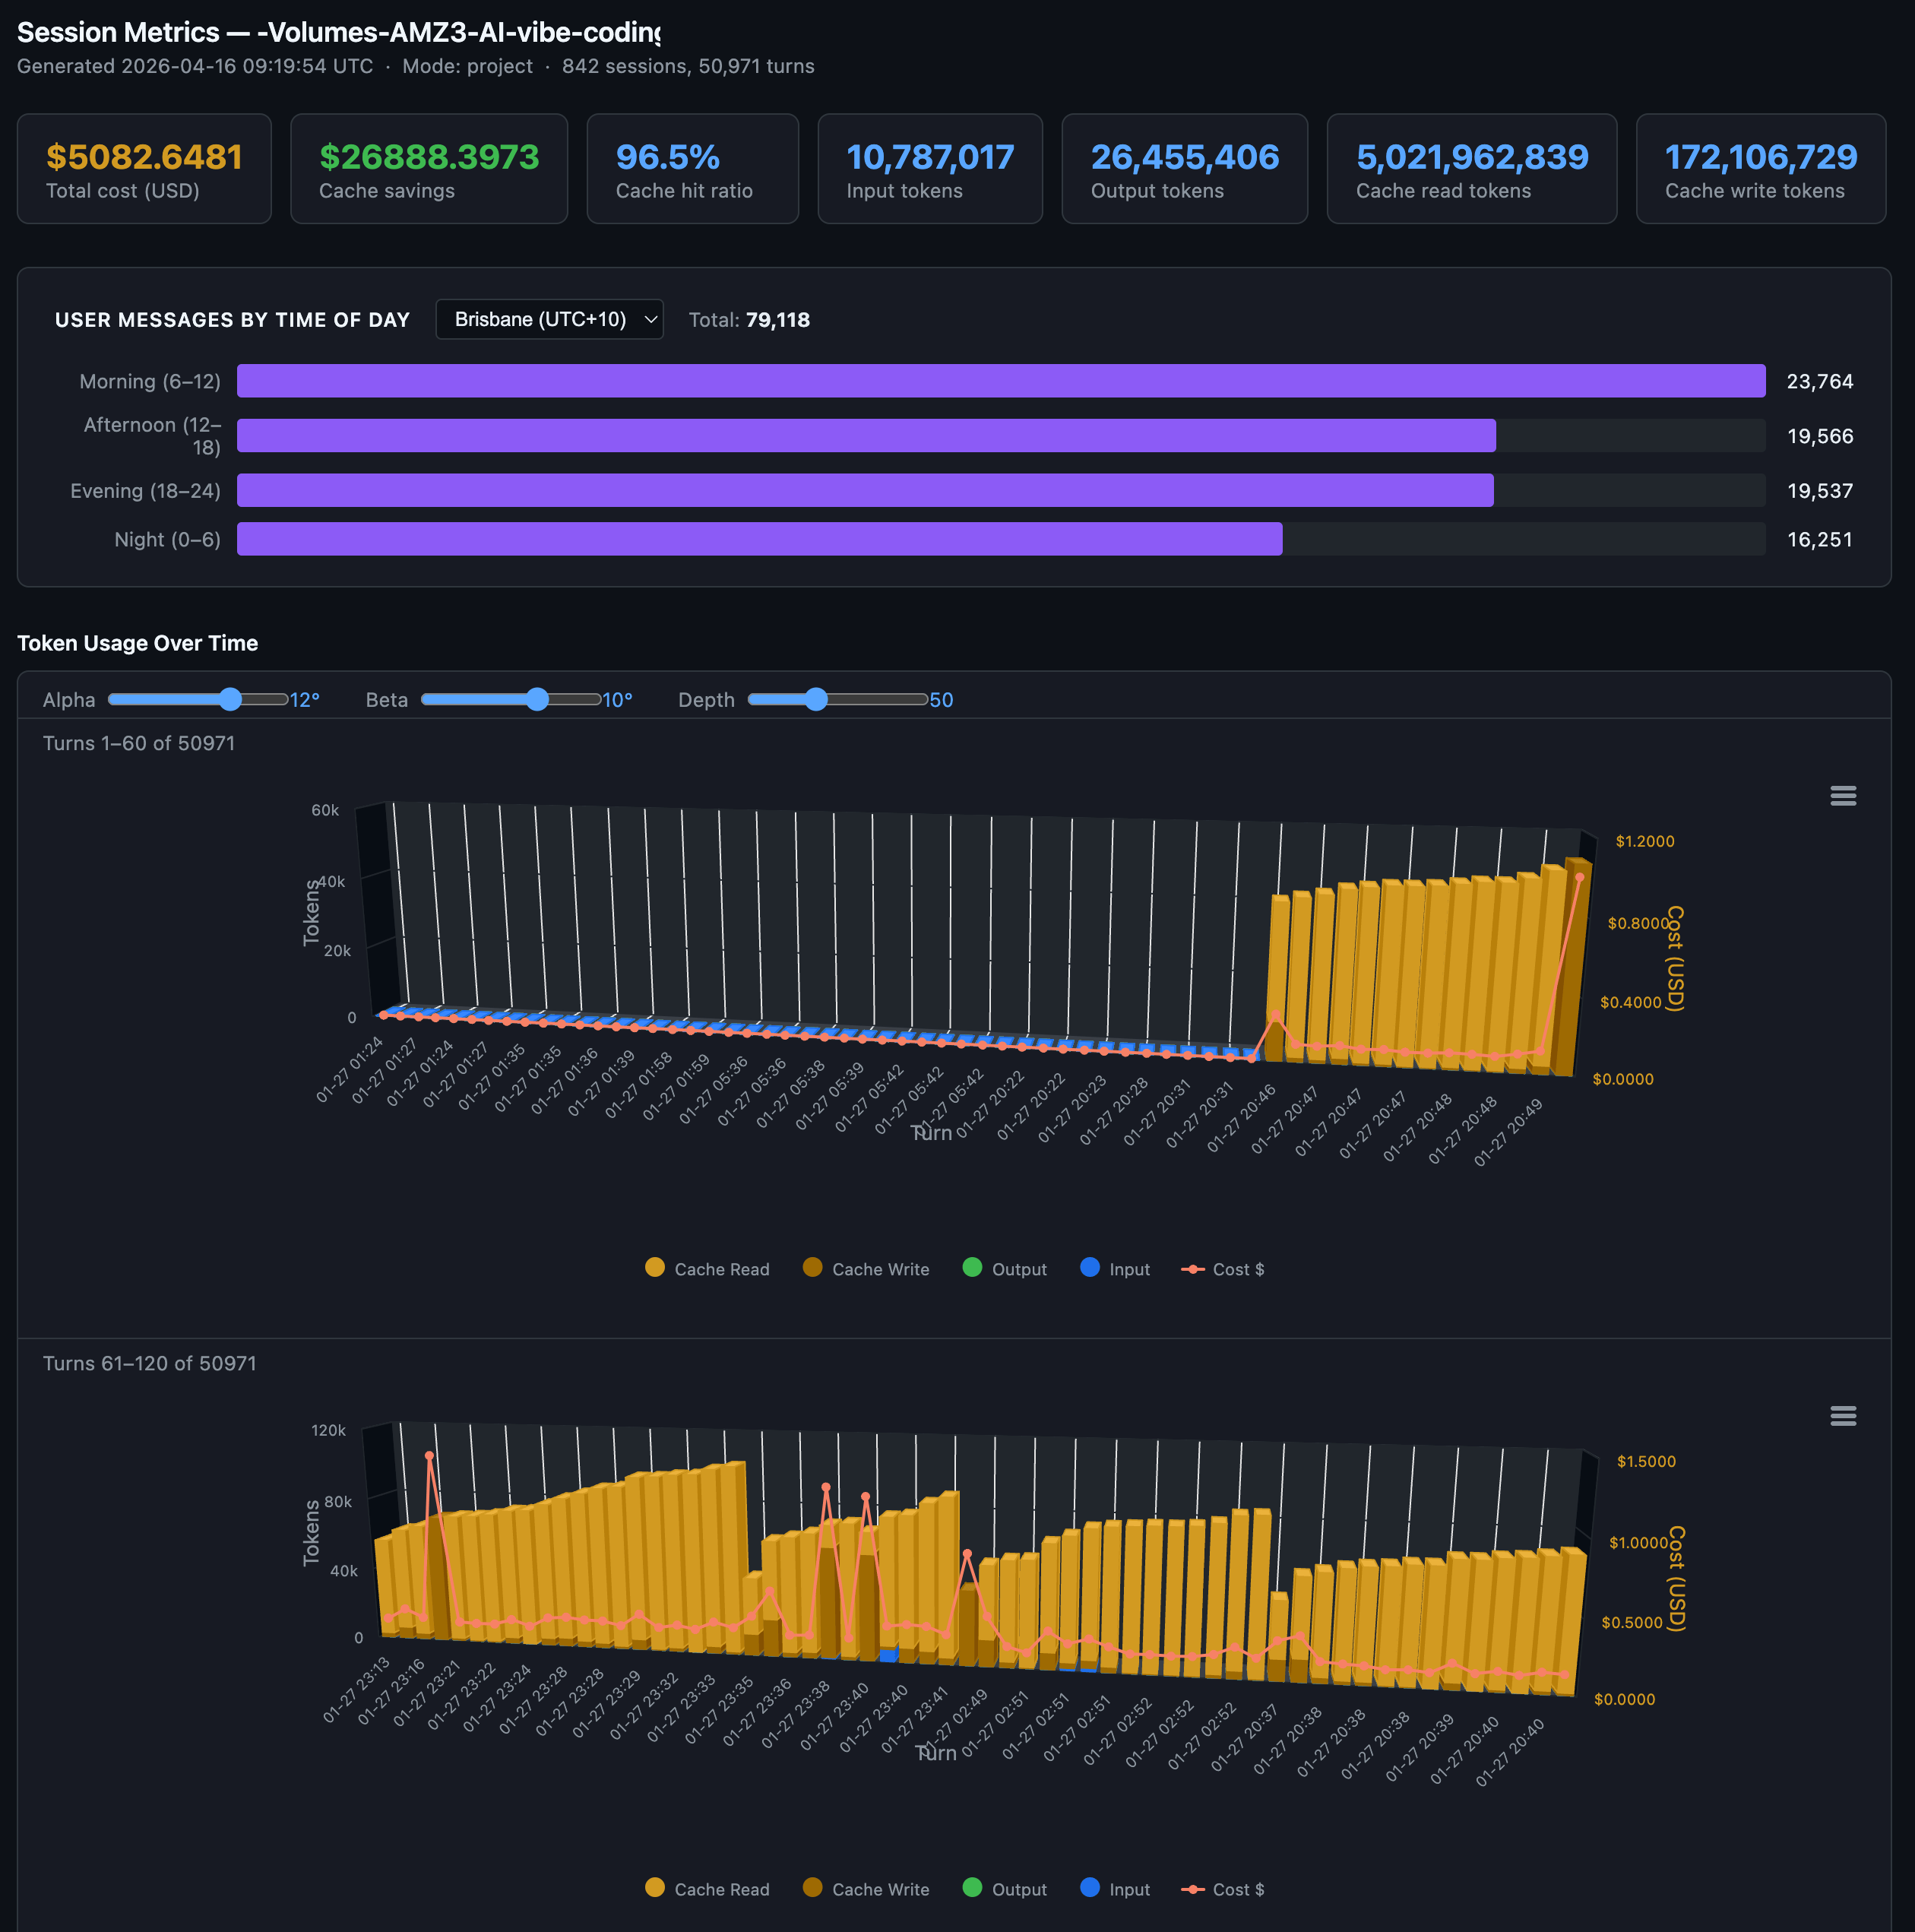
Another larger Claude Code project with 96.5% cache hit ratio with 10.7 million input tokens, 26.45 million output tokens, 5 billion cache read tokens and 172 million cache write tokens over 50,971 turns over 842 sessions. This project was mainly before I shifted my Claude Code sessions to off-peak times, so they are shown to be more uniformly spread out throughout the day.
What the numbers taught me about token efficiency
After looking at 3,031 turns of data across 44 sessions, a few patterns stood out.
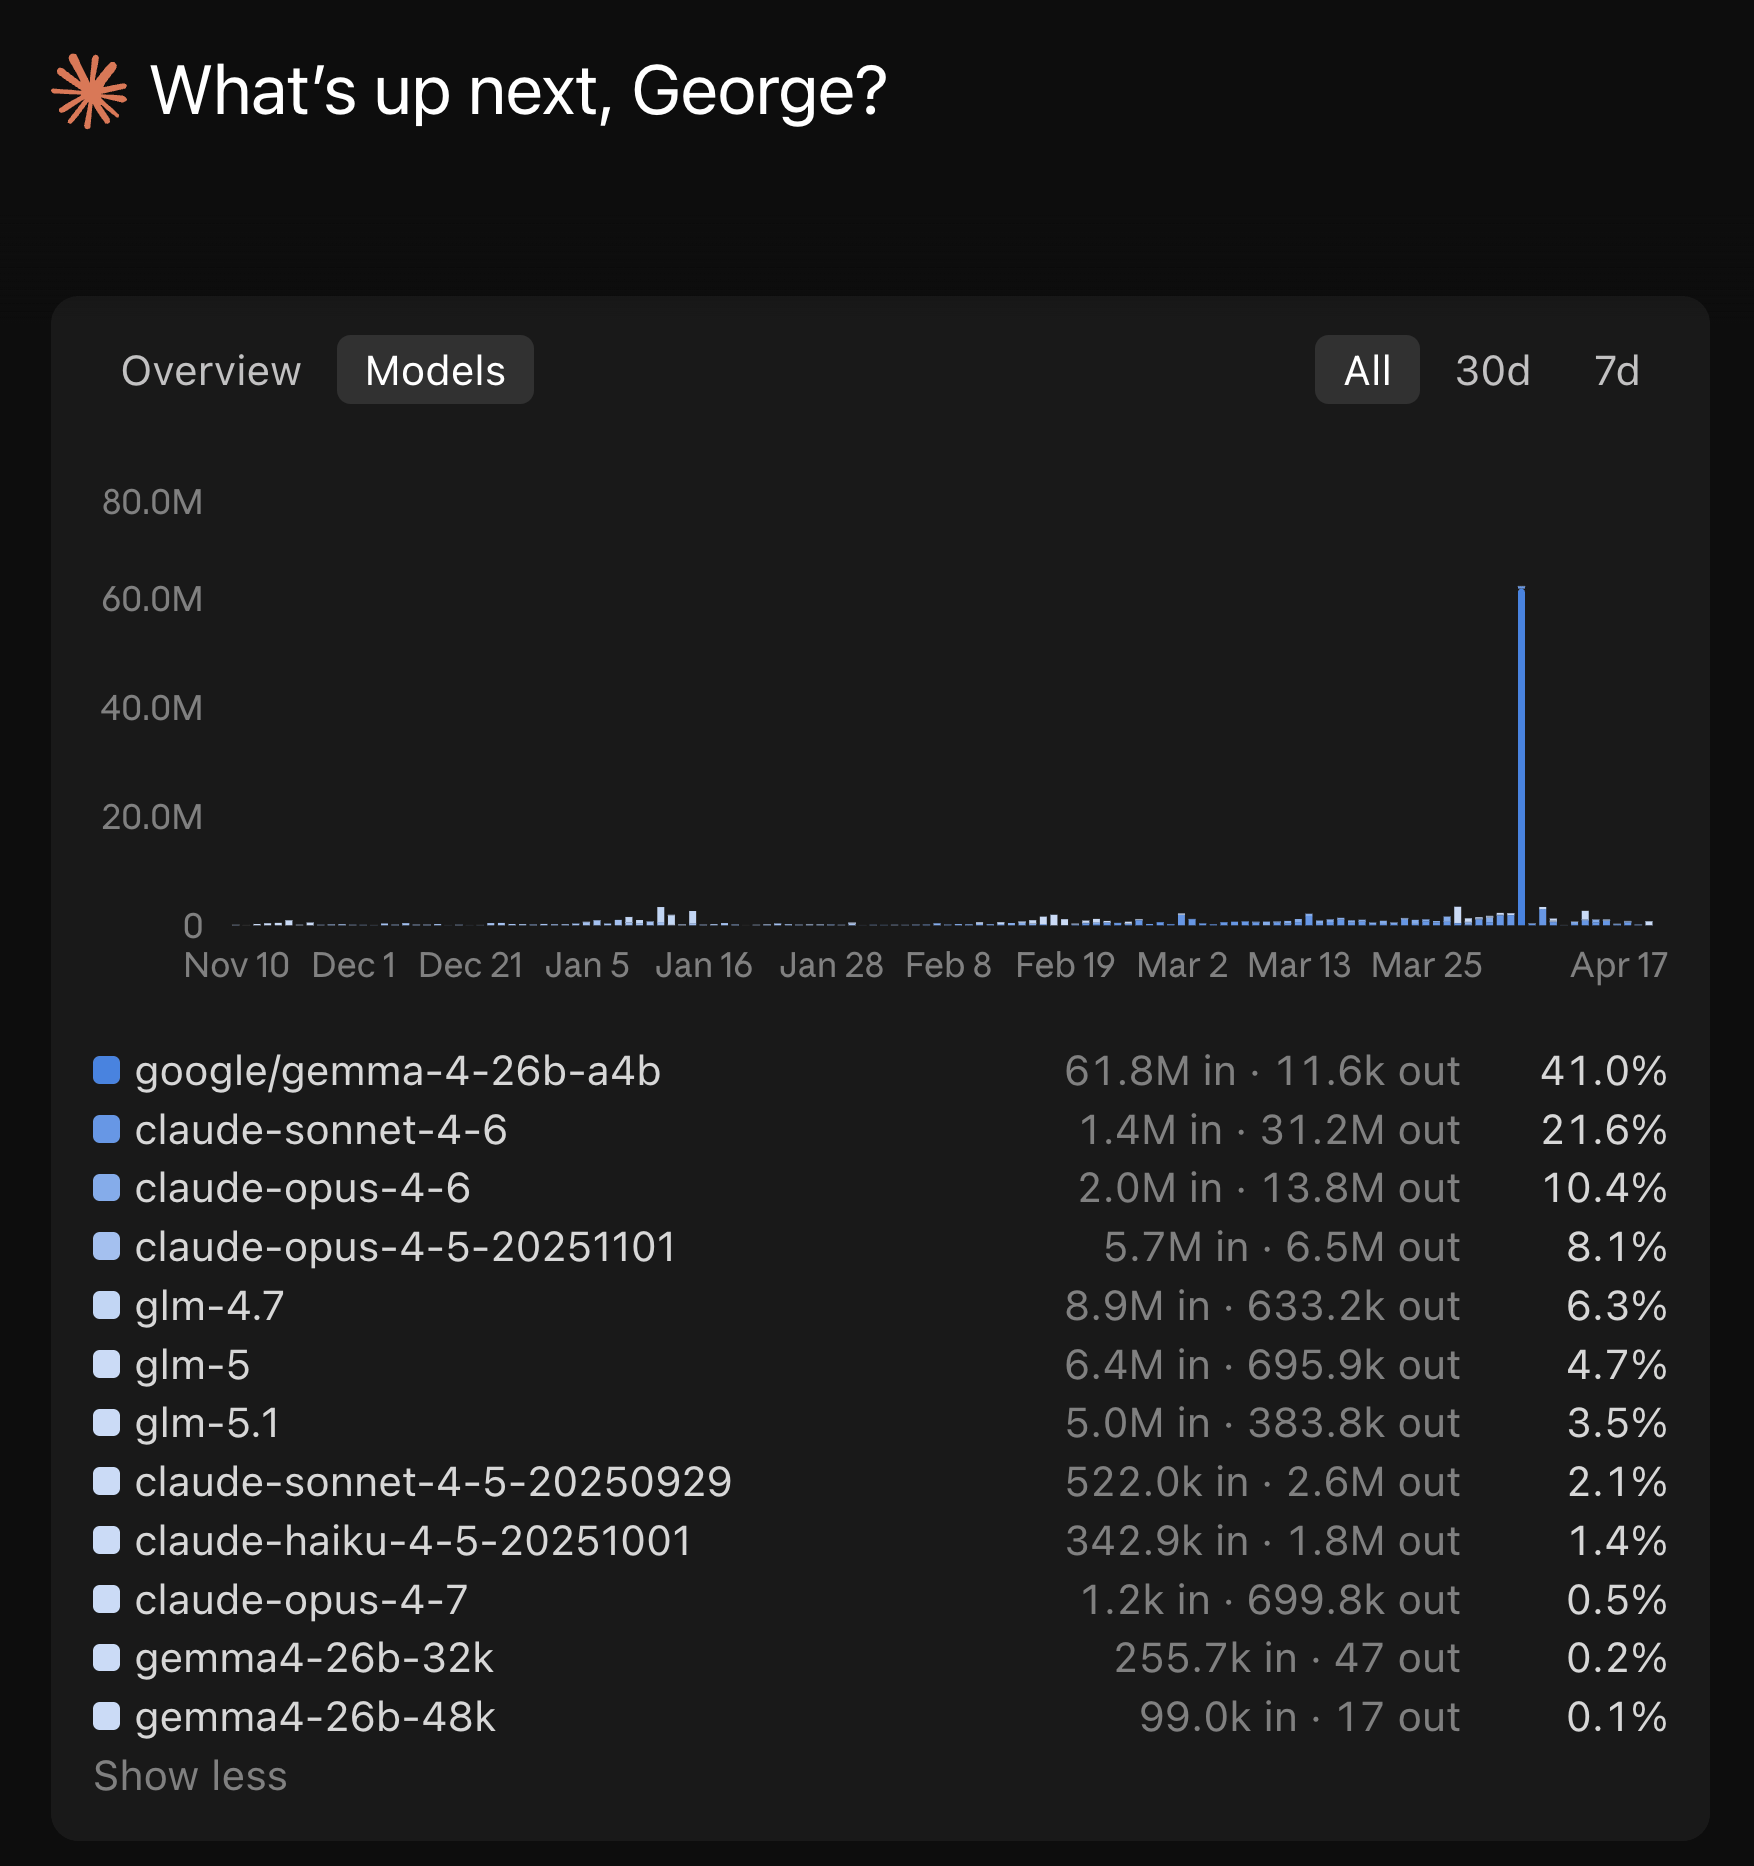
Cache reads dominate everything. 309 million cache read tokens versus 146,000 uncached input tokens. Claude Code’s prompt caching is doing the heavy lifting.

What breaks the cache:
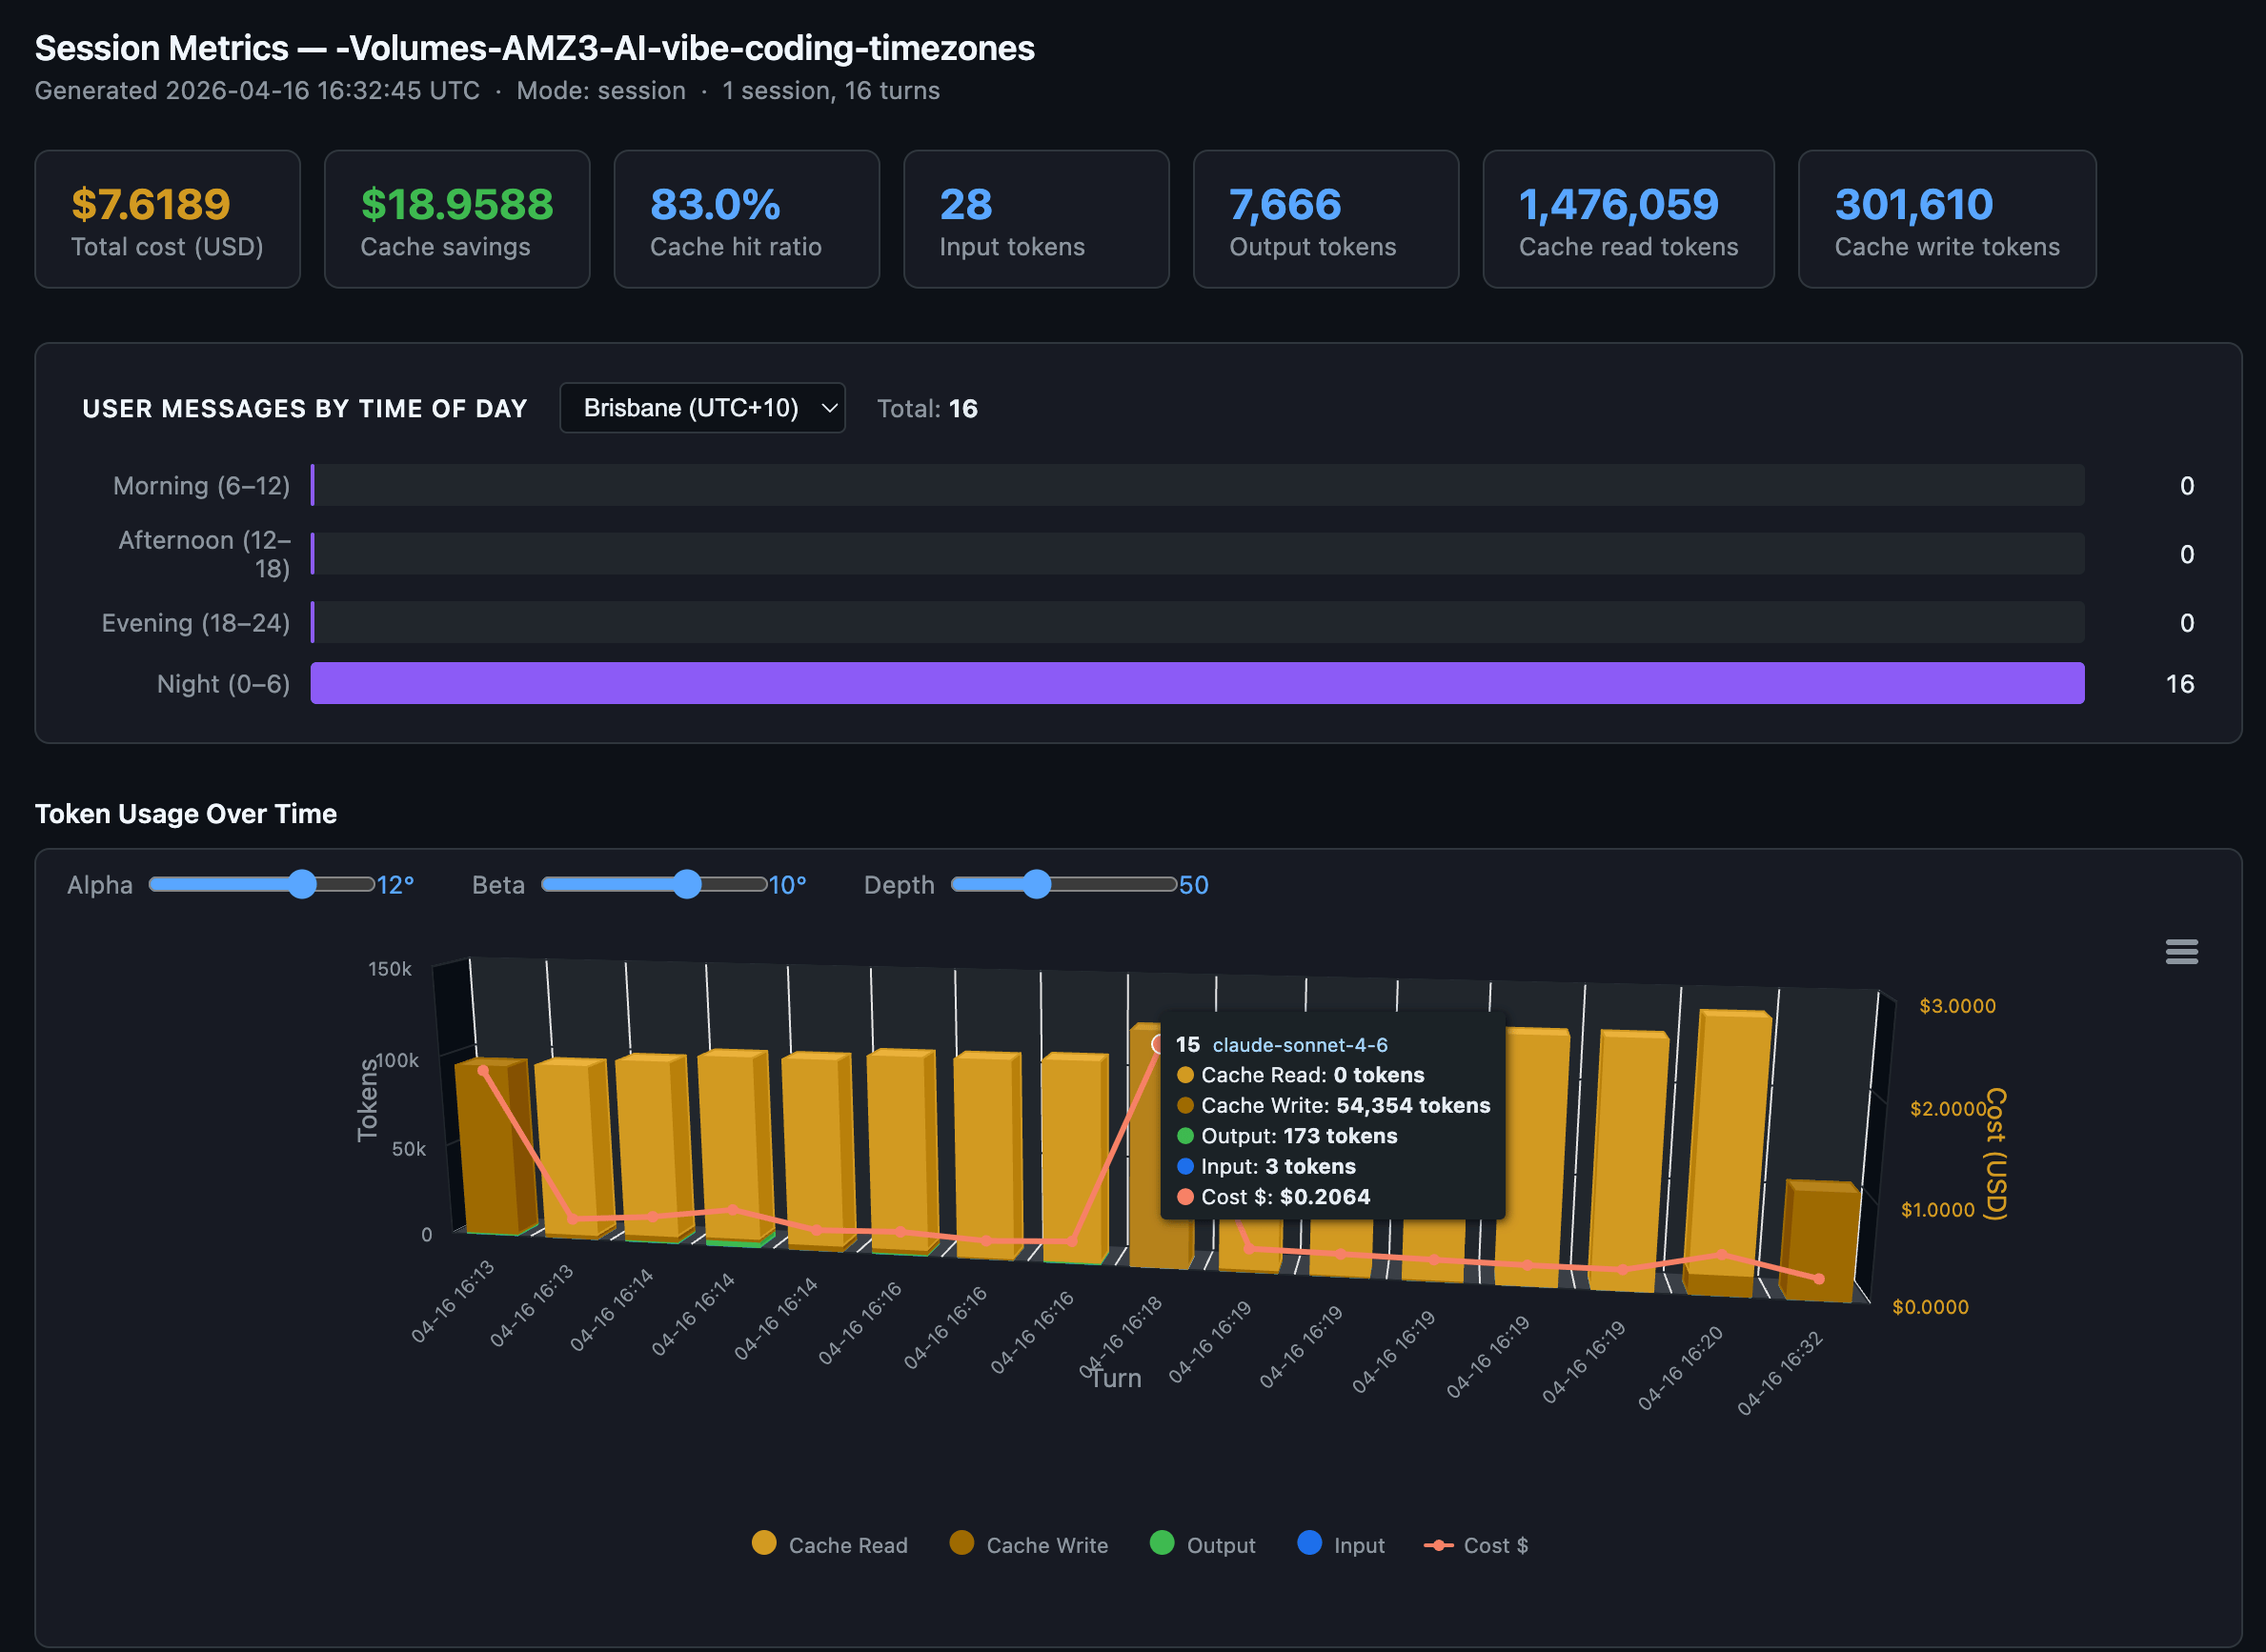
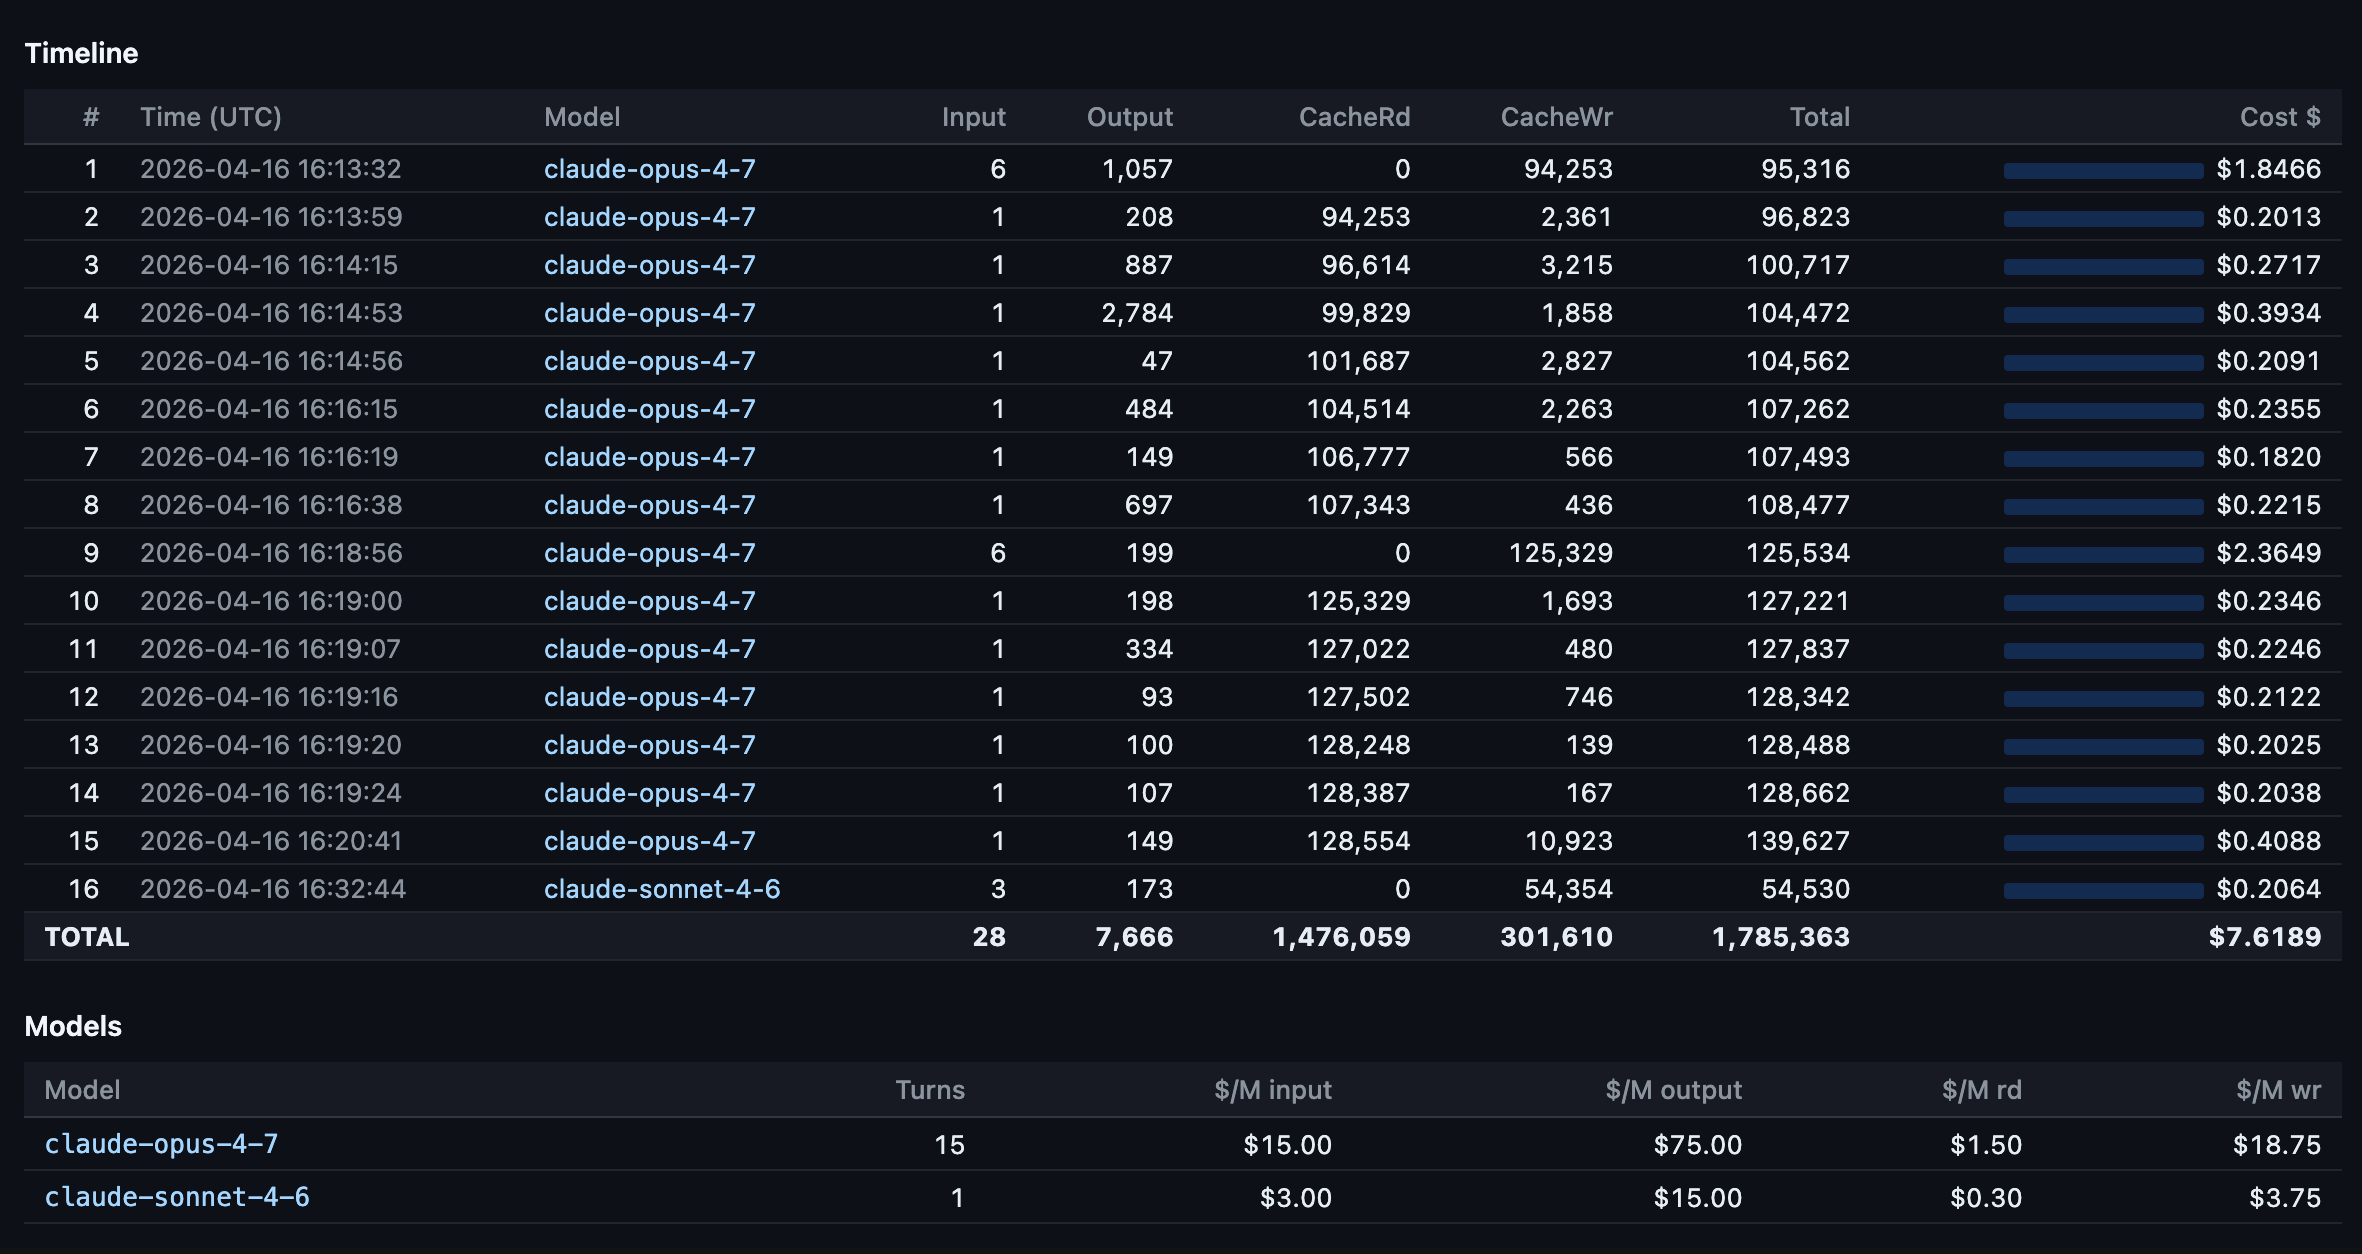
Switching models mid-session. This was the most visible finding. At turn 19 of one session, I switched from Opus 4.6 to Sonnet 4.6. Cache reads dropped to exactly 0 and cache writes spiked to 92,170 tokens. Each model maintains its own cache, so the entire prior context had to be re-written. At Opus cache write pricing ($18.75 per million tokens), that single switch cost about $1.73 in re-cached input. Do it a few times per session and you burn through the savings you thought caching was giving you. If you need to switch models, start a new session.
Editing CLAUDE.md mid-session. Any change to the conversation prefix invalidates the cache from that point forward. Edit between sessions, not during them.
Long pauses beyond your cache TTL. On Pro (5-minute TTL), even a quick coffee break can nuke your cache. On Max (1-hour TTL), you have more room, but leave for lunch and you’re paying full re-cache cost on return. The session metrics timestamps make these gaps visible: idle time exceeding your TTL shows up as a cache write spike on the very next turn.
Adding or disabling MCP tools also can break your cache prefix.
Topic drift without
/clear. The context keeps growing with irrelevant conversation history, increasing token usage per turn without benefiting the current task.
What preserves the cache:
Stay on one topic per session. The conversation prefix stays stable, cache hits stay high.
Use
/clearwhen switching tasks,/resumeto come back later.Batch related requests into fewer, more detailed prompts. Each message triggers a full context send, so fewer messages means fewer sends.
Check costs with
/costduring the session and/statusbefore big tasks. Just knowing what things cost changes how you work.
The community has figured out more levers than Anthropic documents. A comprehensive workaround guide on r/ClaudeAI compiled by users tracking rate limits has several Claude Code-specific optimizations:
Disable Adaptive thinking method for Claude Opus 4.6 by setting CLAUDE_CODE_DISABLE_ADAPTIVE_THINKING to 1. And then set old thinking method using,
MAX_THINKING_TOKENSto 10000 (down from 32K default),CLAUDE_AUTOCOMPACT_PCT_OVERRIDEto 50 (compact at 50% context instead of 95%), andCLAUDE_CODE_SUBAGENT_MODELto haiku insettings.json. Reportedly cuts consumption 60-80%. My Claude Code starter template GitHub repo has shipped withMAX_THINKING_TOKENSin its defaultsettings.local.jsonsince before Opus 4.6 introduced adaptive thinking. The two approaches differ:MAX_THINKING_TOKENSsets a hard ceiling on thinking tokens per request, giving you predictable costs but no flexibility. Adaptive thinking lets the model decide how much to think based on task complexity - simple tasks get minimal thinking, complex planning gets more. Adaptive thinking is now the Opus 4.6 default, and for most users it’s the better choice. But if you’re on a tight token budget or need deterministic cost control, a fixedMAX_THINKING_TOKENS(like the 8192 in my starter template) still makes sense.Keep CLAUDE.md lean. It loads into every message. Users recommend under 60 lines (~800 tokens), pushing detail into
docs/files loaded on demand. A bloated 11,000-token CLAUDE.md is 90% overhead on every turn. More on this below.Create a
.claudeignorefile. Like.gitignore, it prevents Claude from readingnode_modules/,dist/, lockfiles, and other directories that add context without value.Switch back to the 200K context window. Anthropic recently changed the default to 1M tokens. If you don’t need the full million, switching back reduces the payload on every request.
Truncate command output in hooks. PostToolUse hooks that pipe through
head/tailprevent massive terminal output from inflating context.There’s also Boucle Framework’s Read-once PreToolUse hook which stops Claude Code from re-reading files it already has in context. A PreToolUse hook that tracks file reads within a session. When Claude tries to re-read a file that hasn’t changed, the hook tells Claude the content is already in context. Saves ~2000+ tokens per prevented re-read.
Change your Claude Code time of day patterns to Anthropic’s designated off-peak times as peak hours will consume your 5hr session usage limits much faster. While weekly usage limits remain unchanged. Anthropic announced peak times as being between 5am–11am PT / 1pm–7pm GMT. I created my Timezones Scheduler app so I can figure out timezone conversions. Check it out at https://timezones.centminmod.com.
One caveat on the CLAUDE.md advice. “Keep it lean” assumes you only run Claude models. I also run ZAI GLM 5.1 inside Claude Code. GLM 5.1 is capable, but at the brevity level where Claude handles progressive disclosure well, GLM 5.1 hits maybe 80% instruction-following accuracy. To close that gap to 90-95%, I had to add more explicit steering and guardrails in my CLAUDE.md and SKILL.md files. The unexpected side effect: those detailed instructions also appear to help Claude on days when developers report degraded Opus 4.6 performance. More explicit instructions leave less room for drift regardless of which model reads them. It’s a theory, but the correlation has been consistent enough that I trust it. The real advice: keep CLAUDE.md as short as possible for the least capable model you run through it. If you only use Claude, lean is fine. If you run multiple models, the extra tokens may pay for themselves in consistency.
Model selection matters, but timing matters more. Opus 4.6 output tokens cost $75 per million. Sonnet 4.6 costs $15. For straightforward code generation, the 5x price difference is hard to justify. Use Opus for architecture decisions and complex reasoning, Sonnet for implementation. But as the turn 19 cache miss shows, switch models between sessions, not during them. The cache write penalty of switching mid-session can erase the savings you were chasing.
Off-peak hours are real. Claude Code’s rate limits tighten during weekdays 5-11 AM PT. My heatmap showed most of my usage lands in that window. Shifting heavy generation work to evenings or weekends visibly stretches the same quota further.
The per-turn data from session metrics makes most of these patterns visible. If your CLAUDE.md is 11,000 tokens, you’ll see it in the cache write on turn 1. If subagents are running on Opus instead of Haiku, you’ll see the cost difference per row.

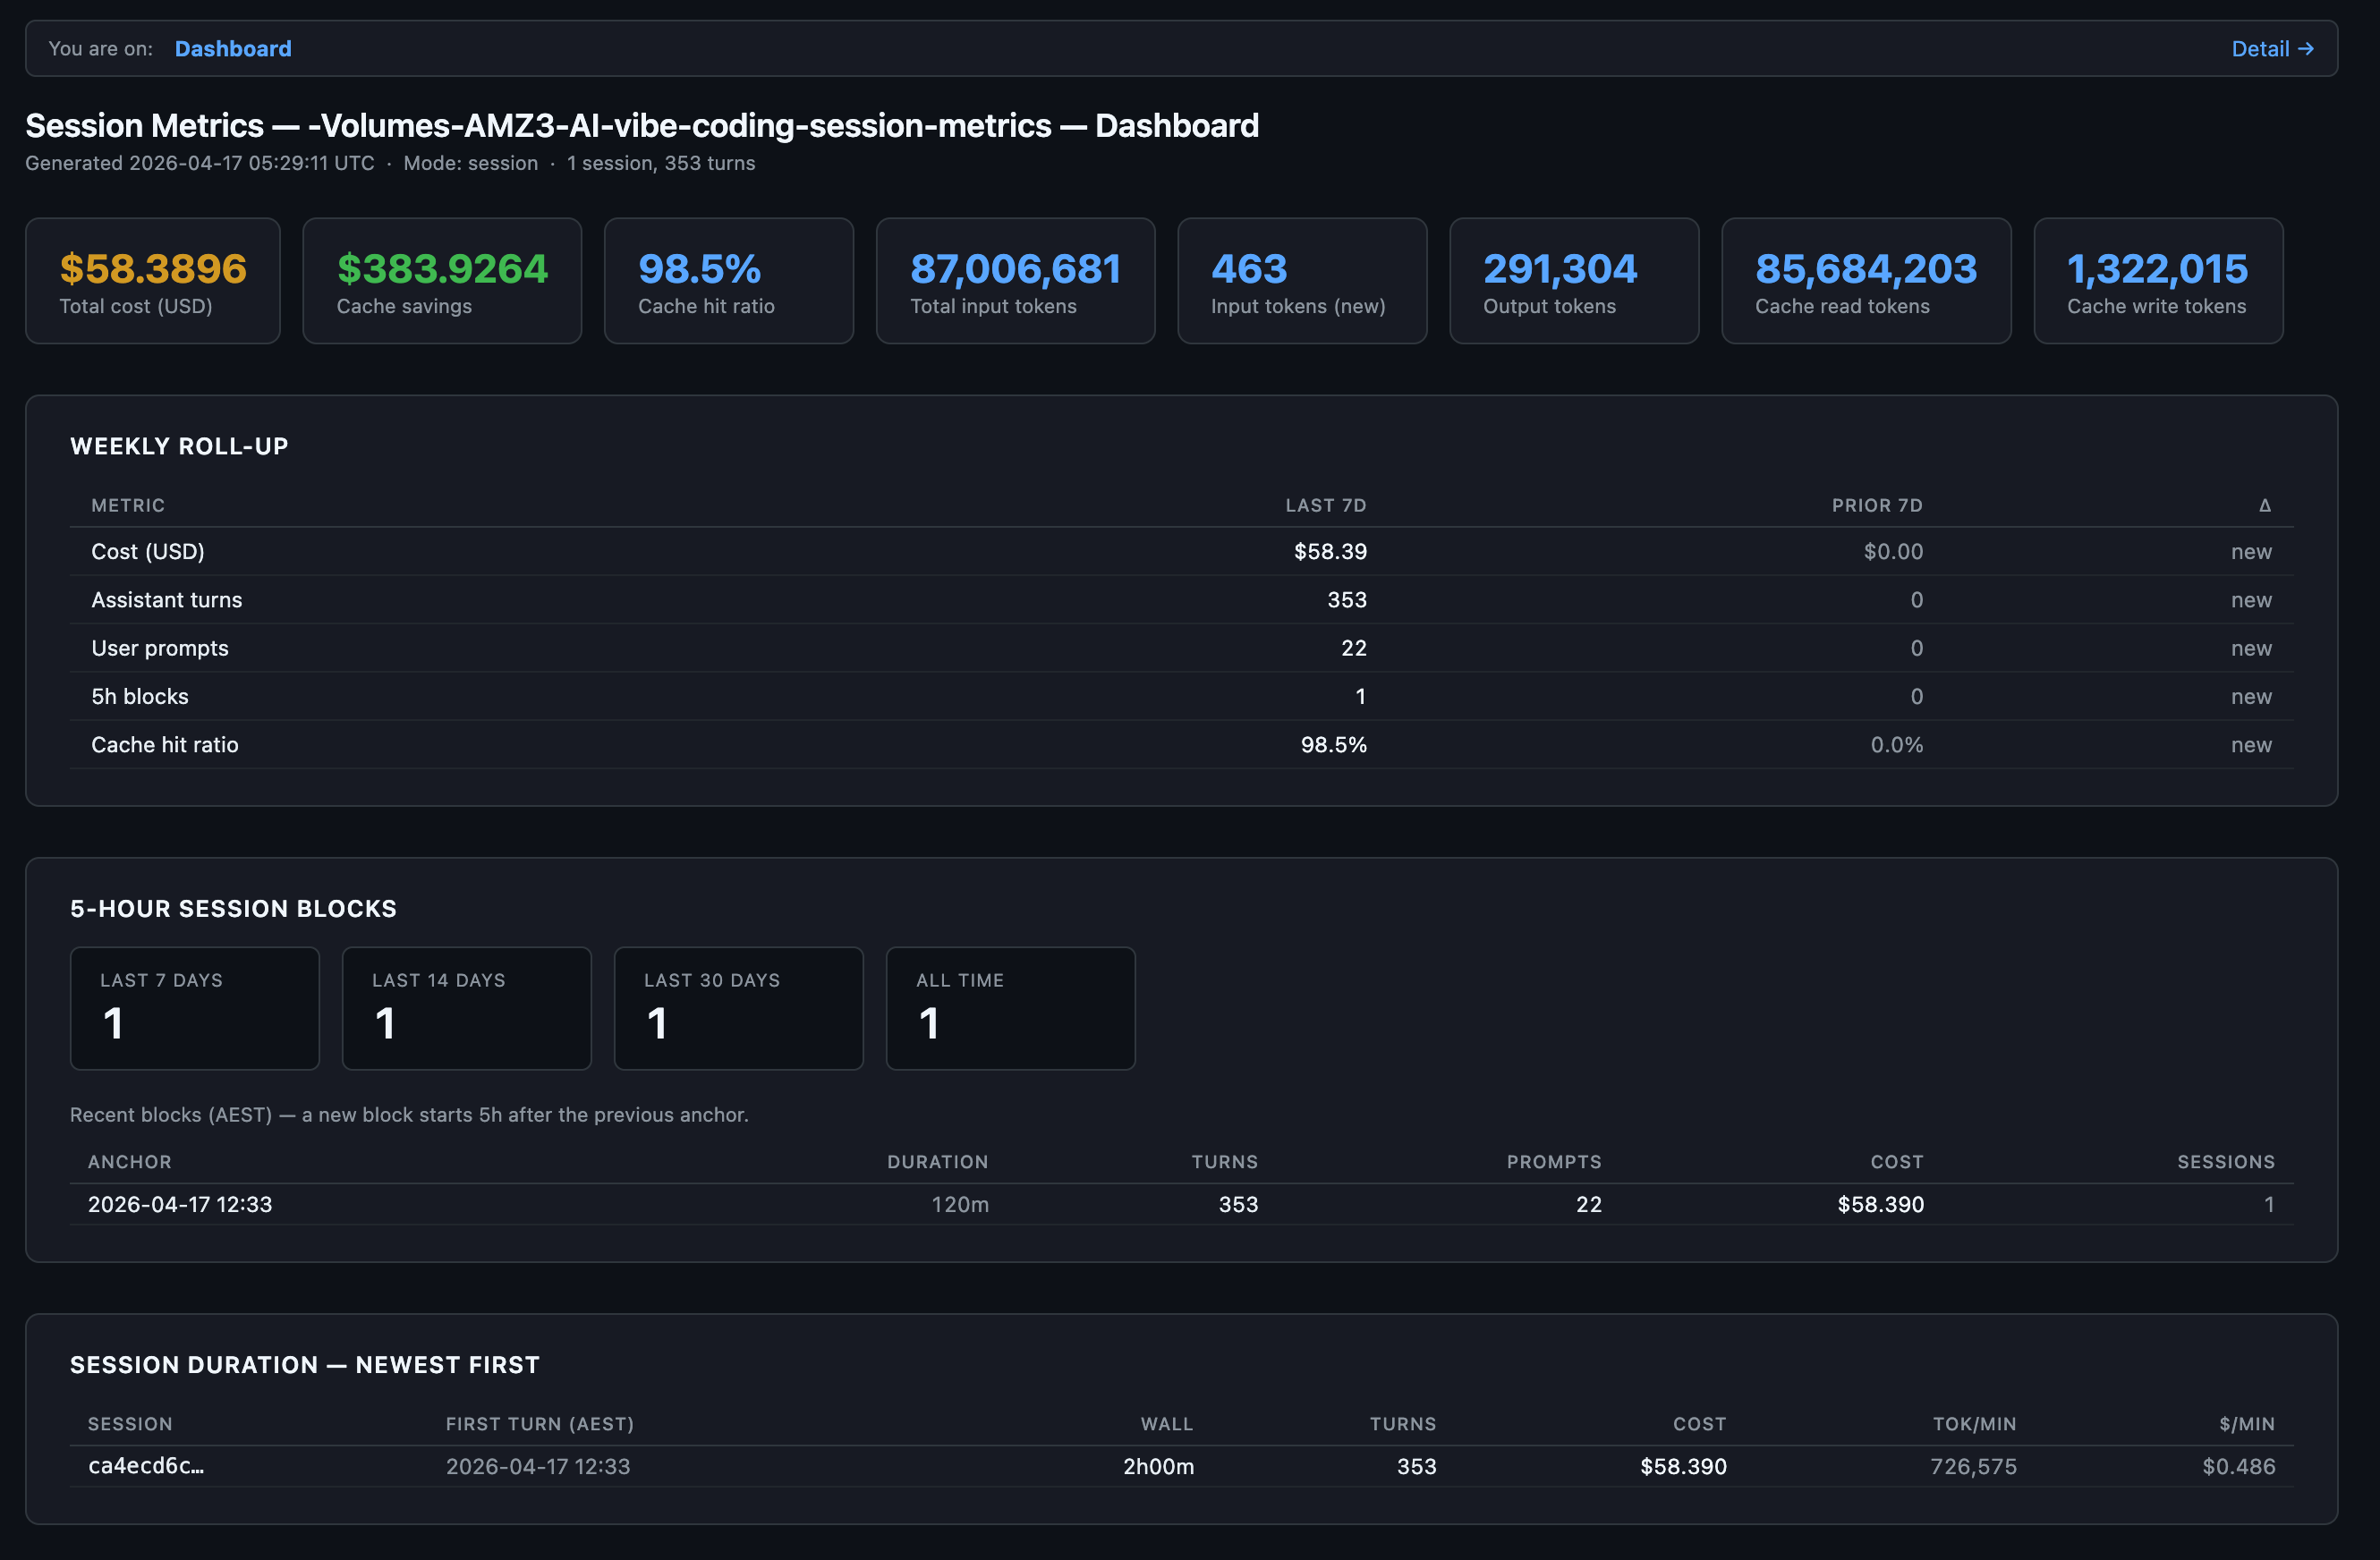
First Claude Opus 4.7 Usage Inspection
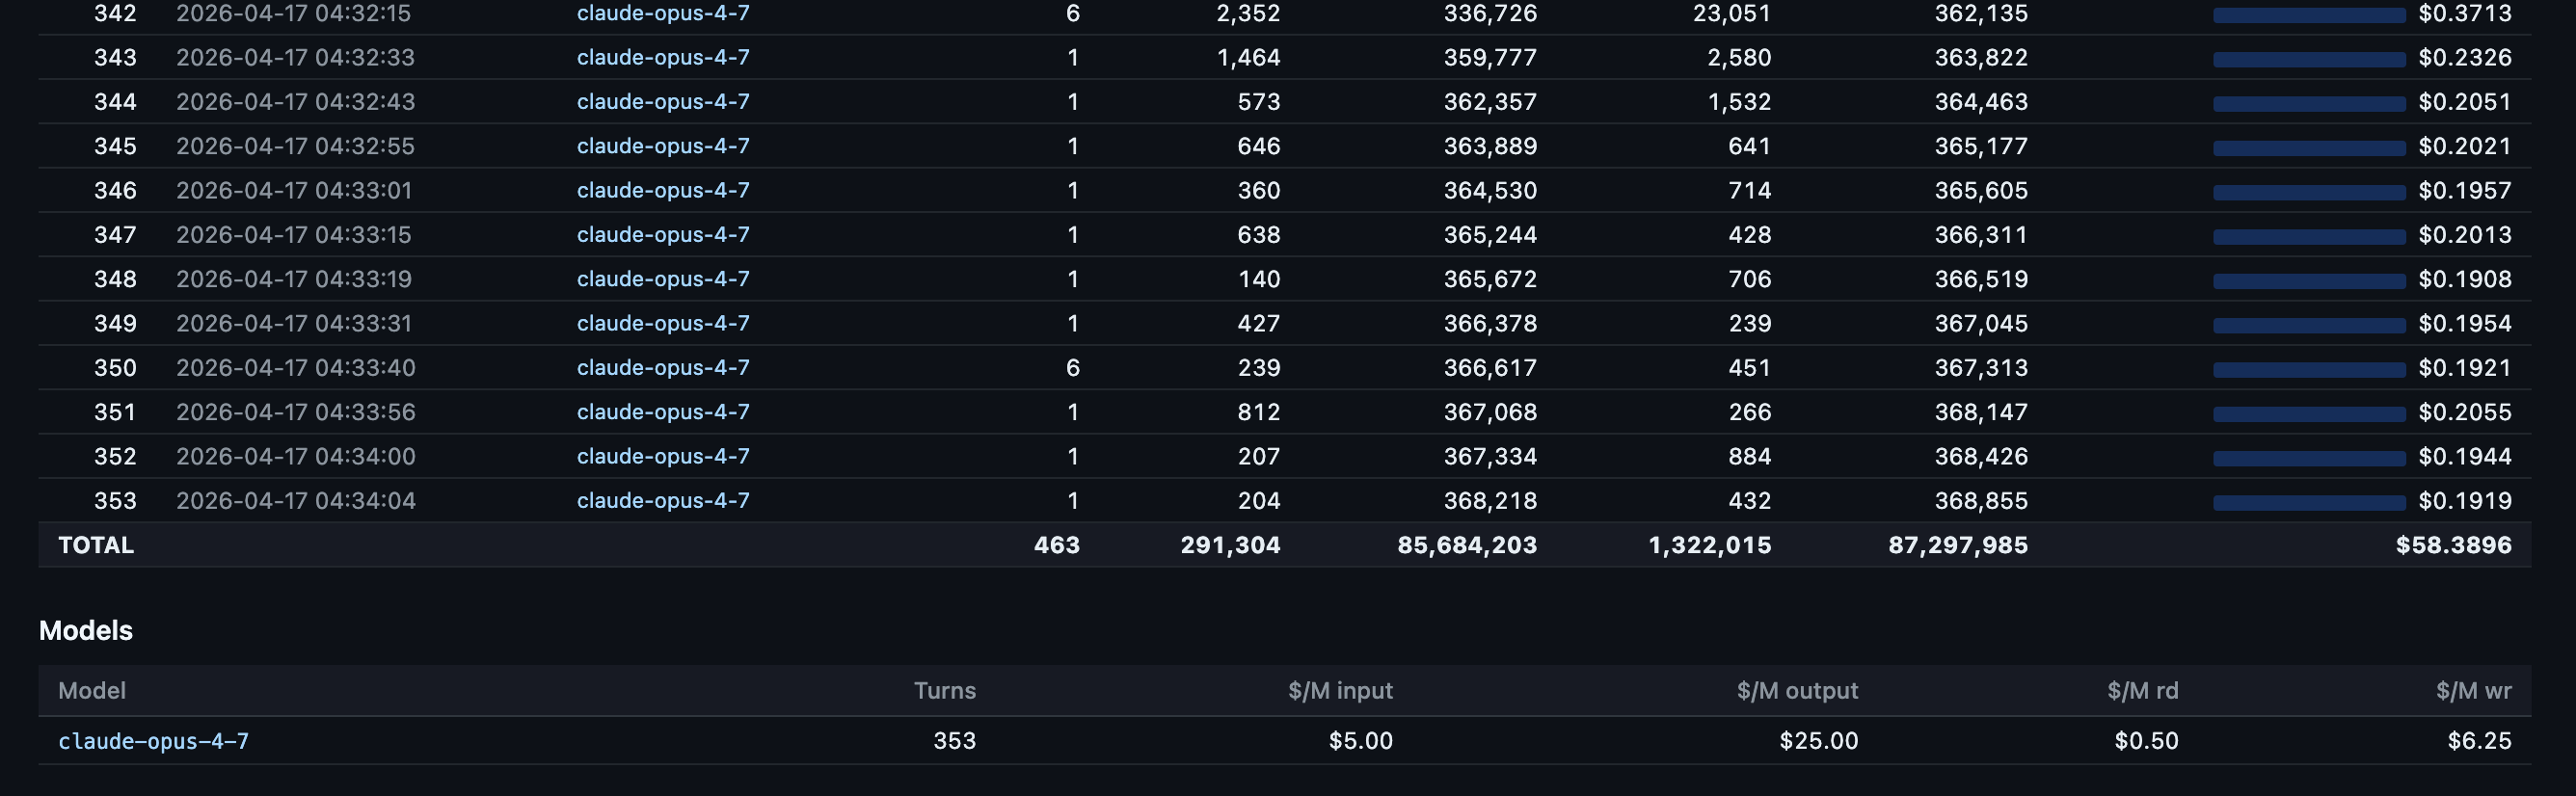
First Claude Opus 4.7 launch session with Claude Code CLI and at end of session switched to Claude Sonnet 4.6 to run my session-metrics skill to inspect Claude Opus 4.7 token consumption and costs for this specific session. Claude Code desktop app has a handy preview pane on the right to see HTML exported session metrics.
Session metrics turn by turn response drill-down of token consumption and costs. Several times in the session we see a full cache miss - with a full cache write.
Opus 4.7 Updated Skill
Claude Opus 4.7 was released today, so I had it analyse and improve the session-metrics skill and it did a wonderful job. I collected both the session metrics and Claude Code OpenTelemetry Grafana usage metrics for the Claude Opus 4.7 session below as well.
session-metrics v1.0
Session-metrics v1.0 just shipped. Its job stays the same - parse Claude Code’s local conversation logs and tell you exactly what each turn cost - but it now answers the question everyone actually asks: am I about to hit my weekly session cap? A new 5-hour session-blocks view groups activity into the same windows Anthropic’s rate limiter uses, with trailing 7/14/30-day counters. An hour-of-day chart and a 7×24 punchcard show when you’re most active, and an optional peak-hour overlay lets you compare your pattern against the community-reported 5–11 AM PT crunch. HTML reports now split into a lightning-fast dashboard page and a separate chart-and-timeline page, so the overview loads instantly even on projects with thousands of turns.
Under the hood it’s also trustworthy now. A bug that inflated the time-of-day histogram by 10–20× on tool-heavy sessions is fixed. The chart library is vendored into the repo with SHA-256 verification - no first-run CDN fetch, so the “zero network” promise is finally true - and a parse cache makes re-runs ~9× faster on unchanged logs. Inputs are validated against path-traversal tricks, timezones are DST-aware via --tz or --utc-offset, and there’s a 63-test pytest suite locking it all in place. Pass --chart-lib none if you want a minimal no-JS report. Point it at a project, and it’ll tell you where your API dollars actually went - and when.
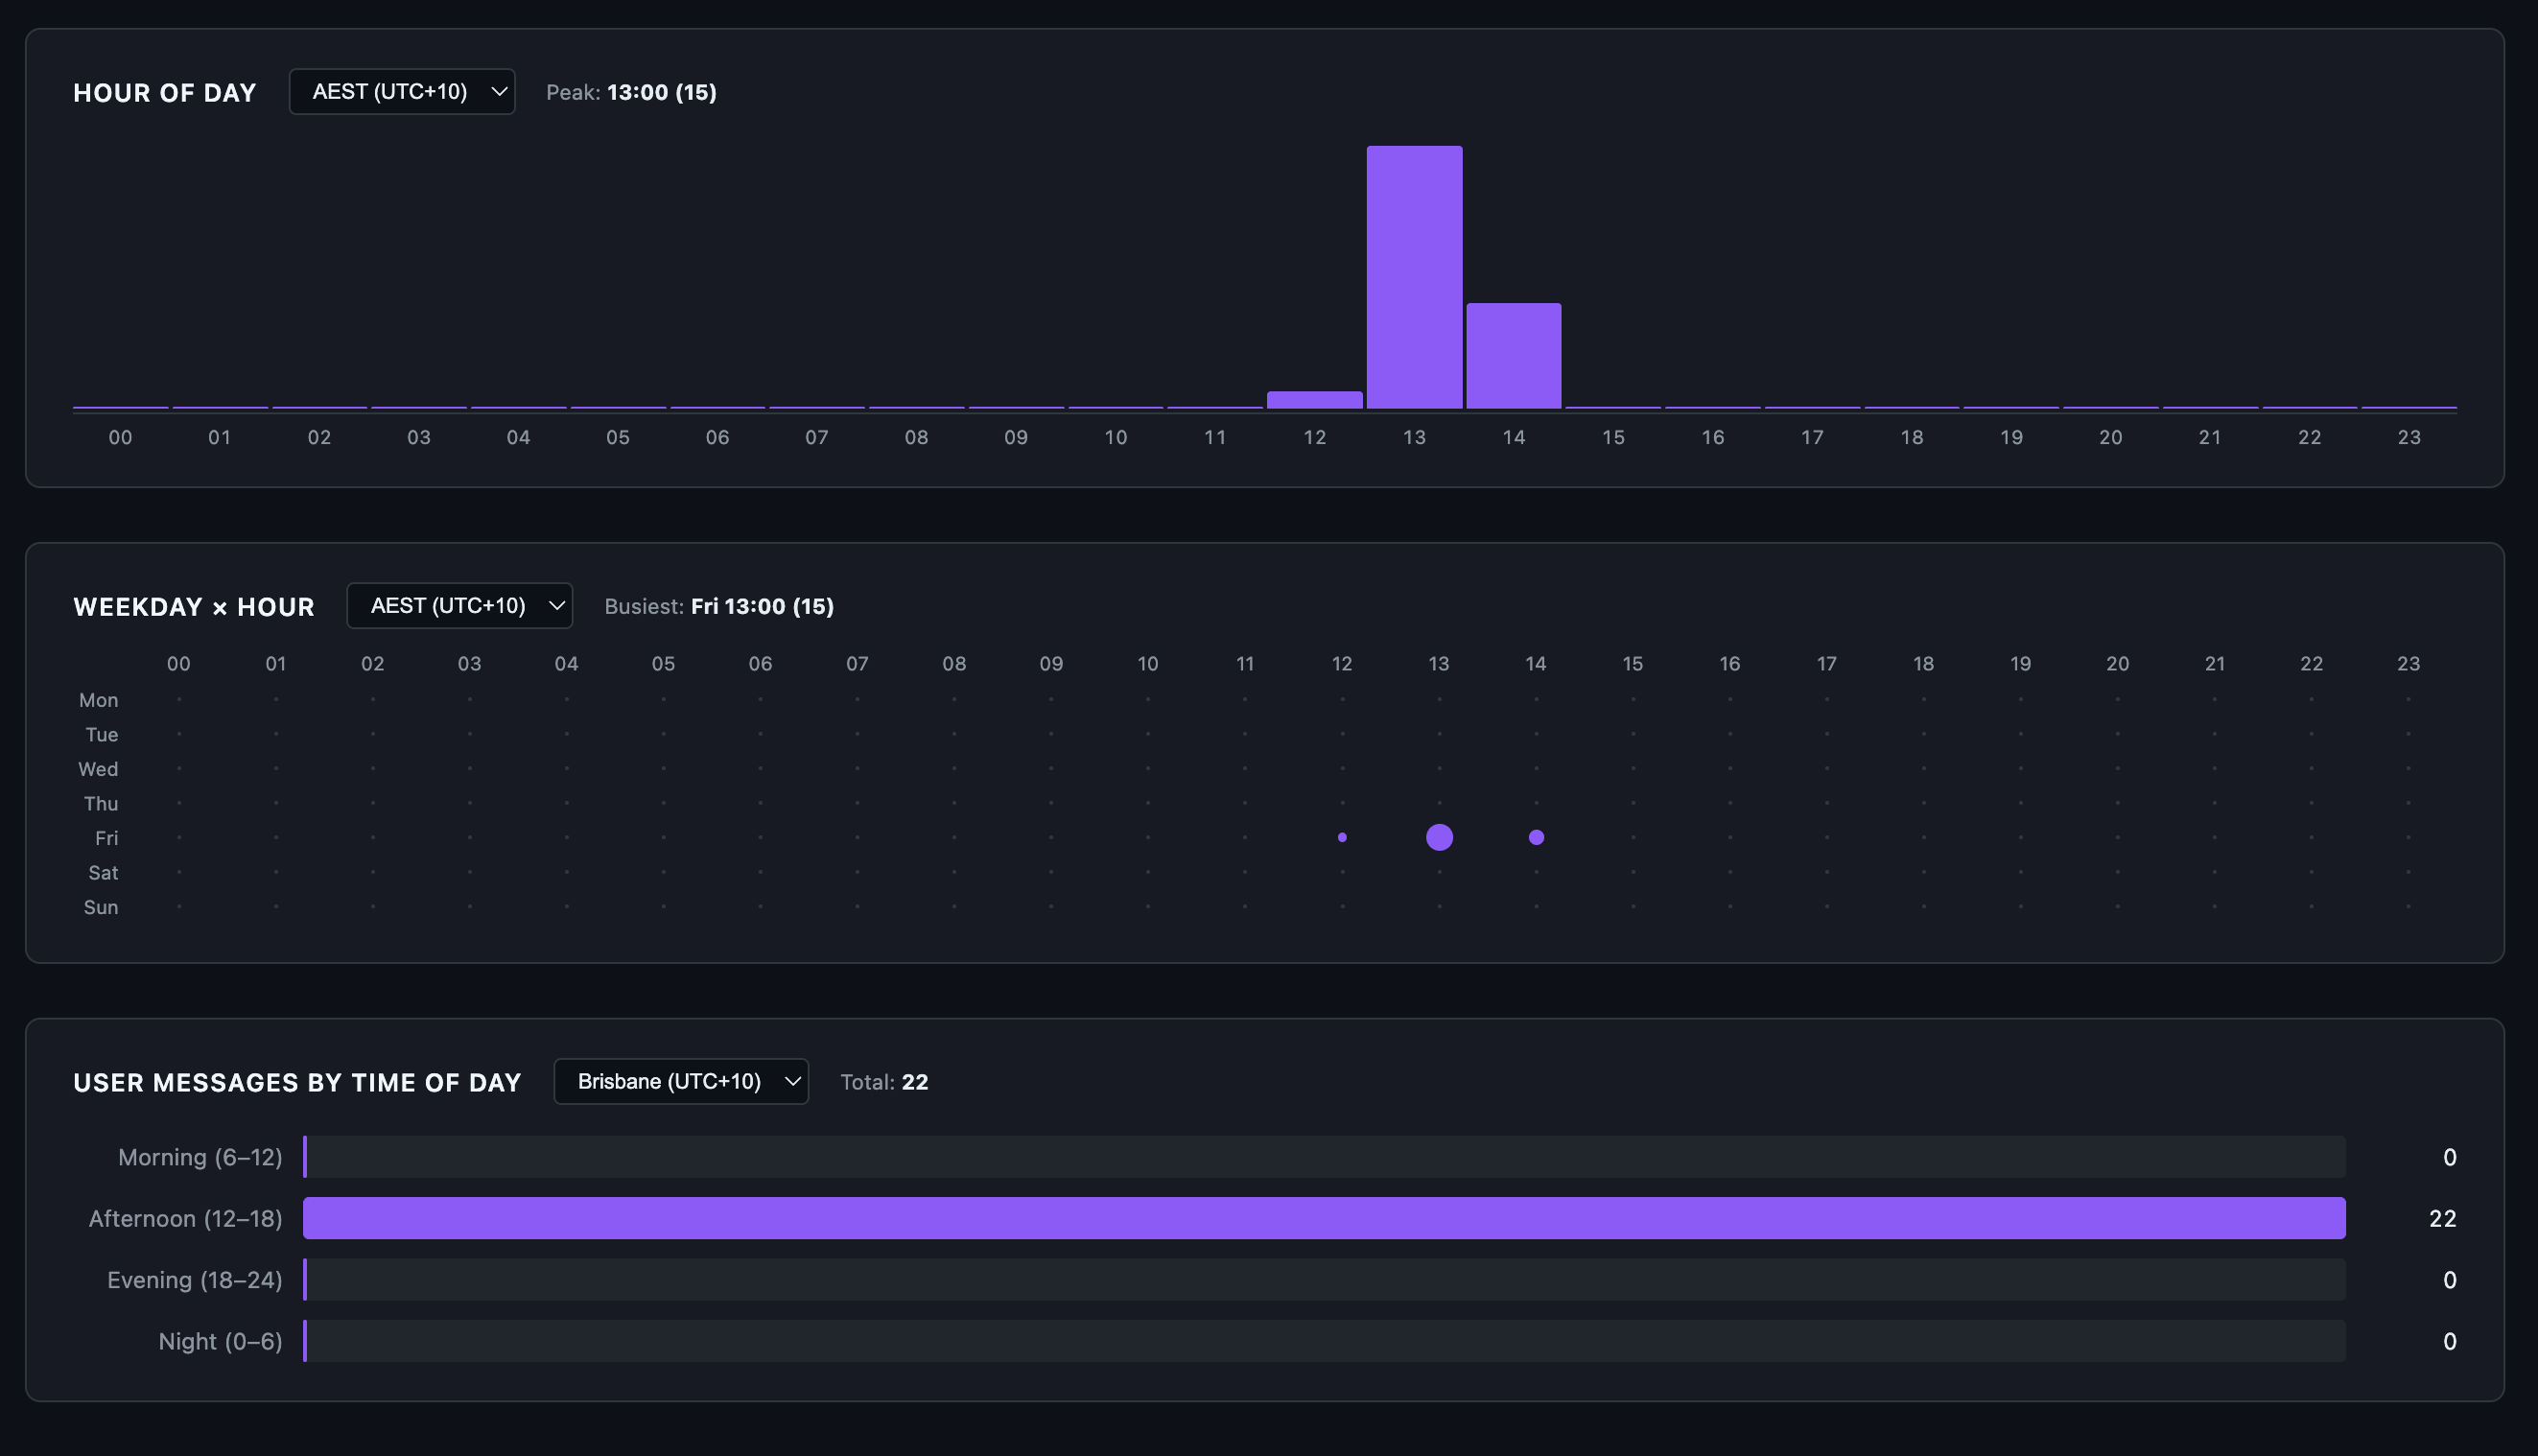
New sessions metric skill exported HTML data for the Claude Code Opus 4.7 chat session used to improve the very skill itself.
Hour of day, week hour and user messages by time of day for this chat session.
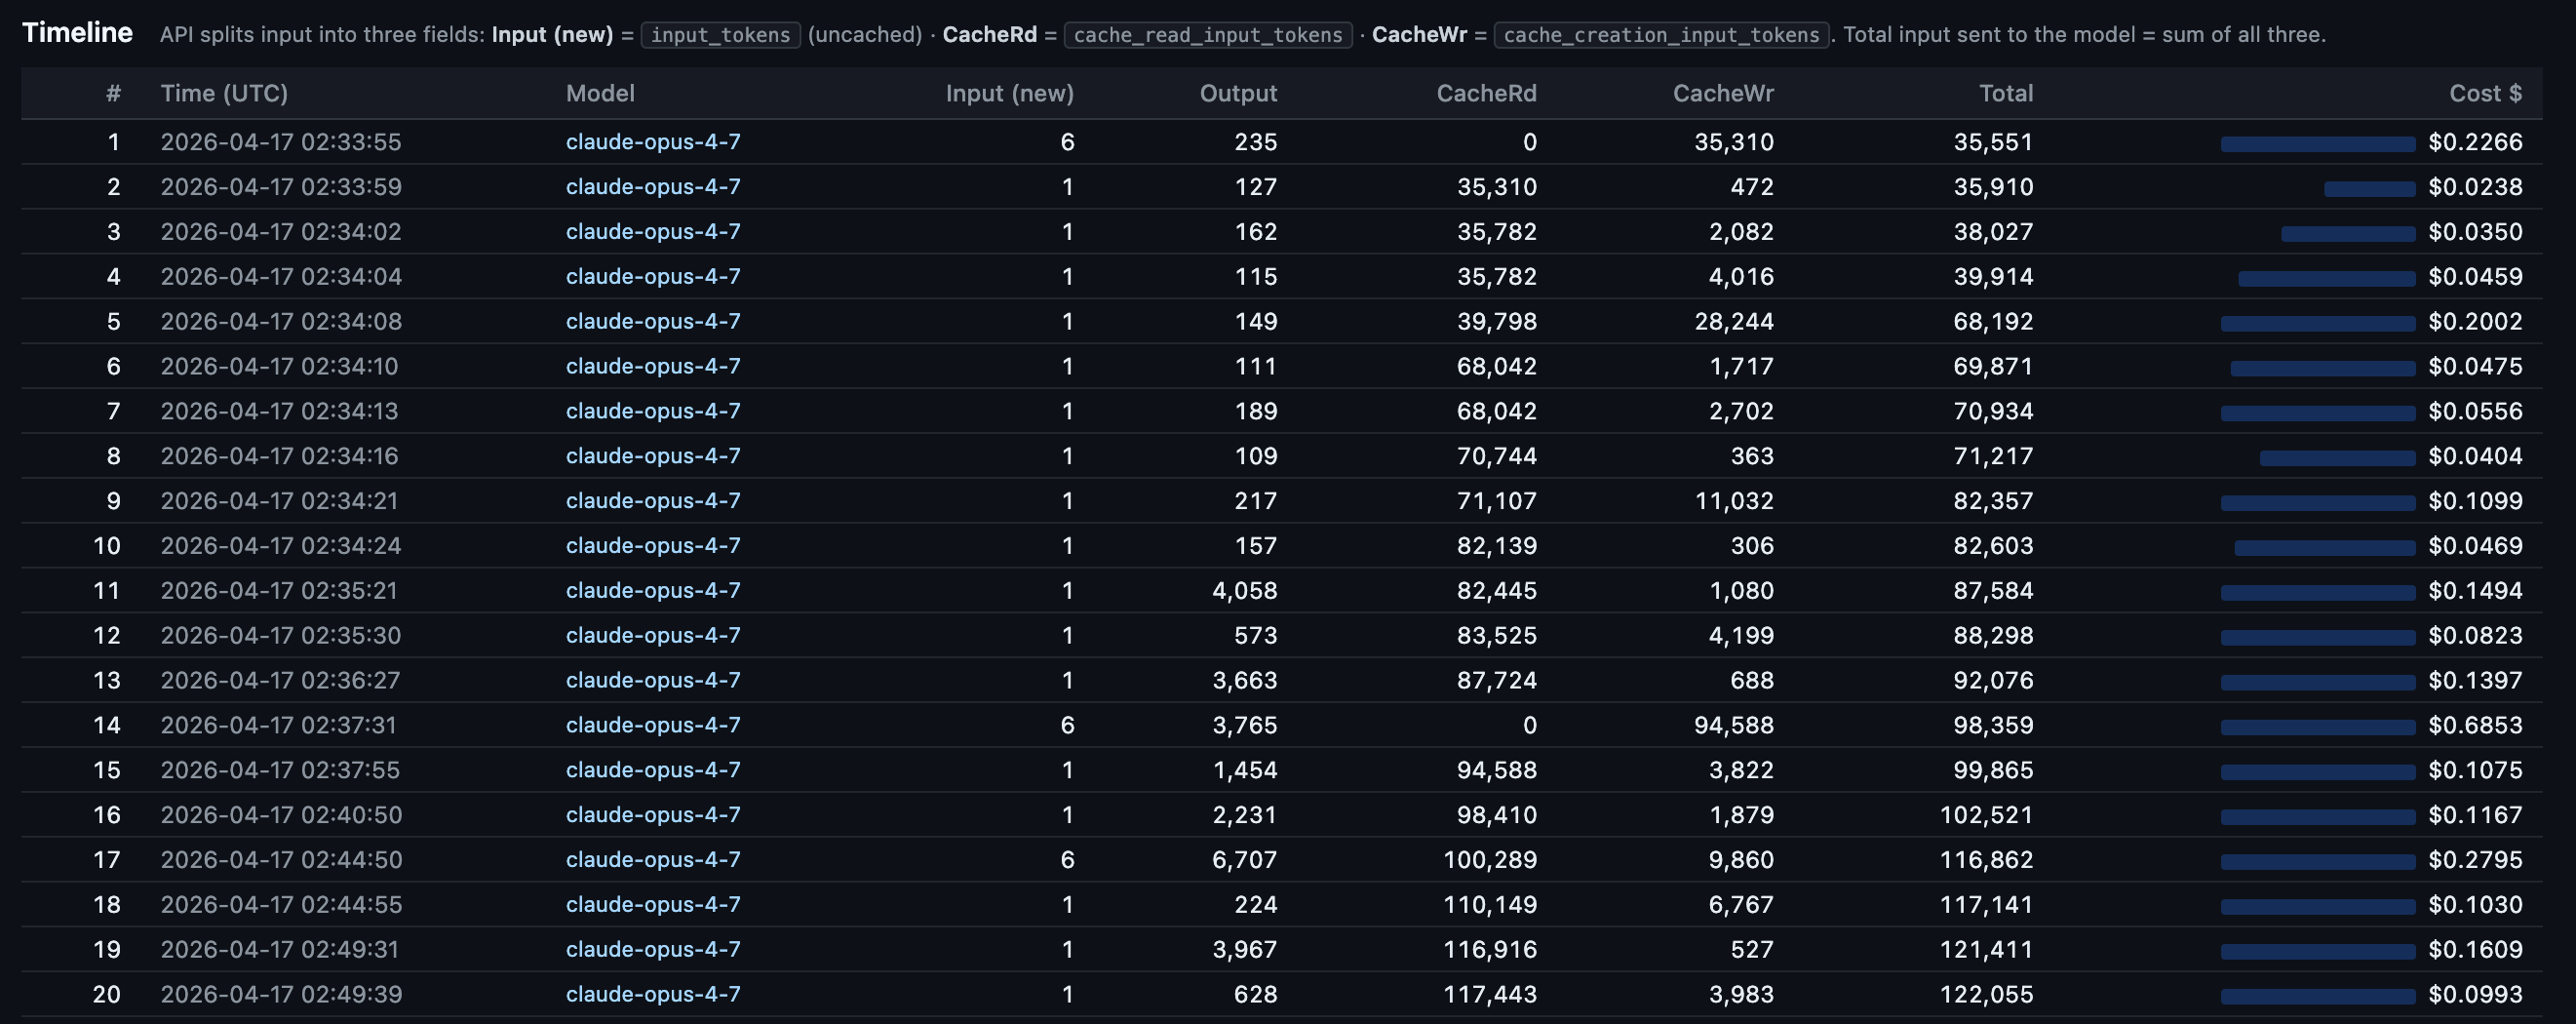
Details page
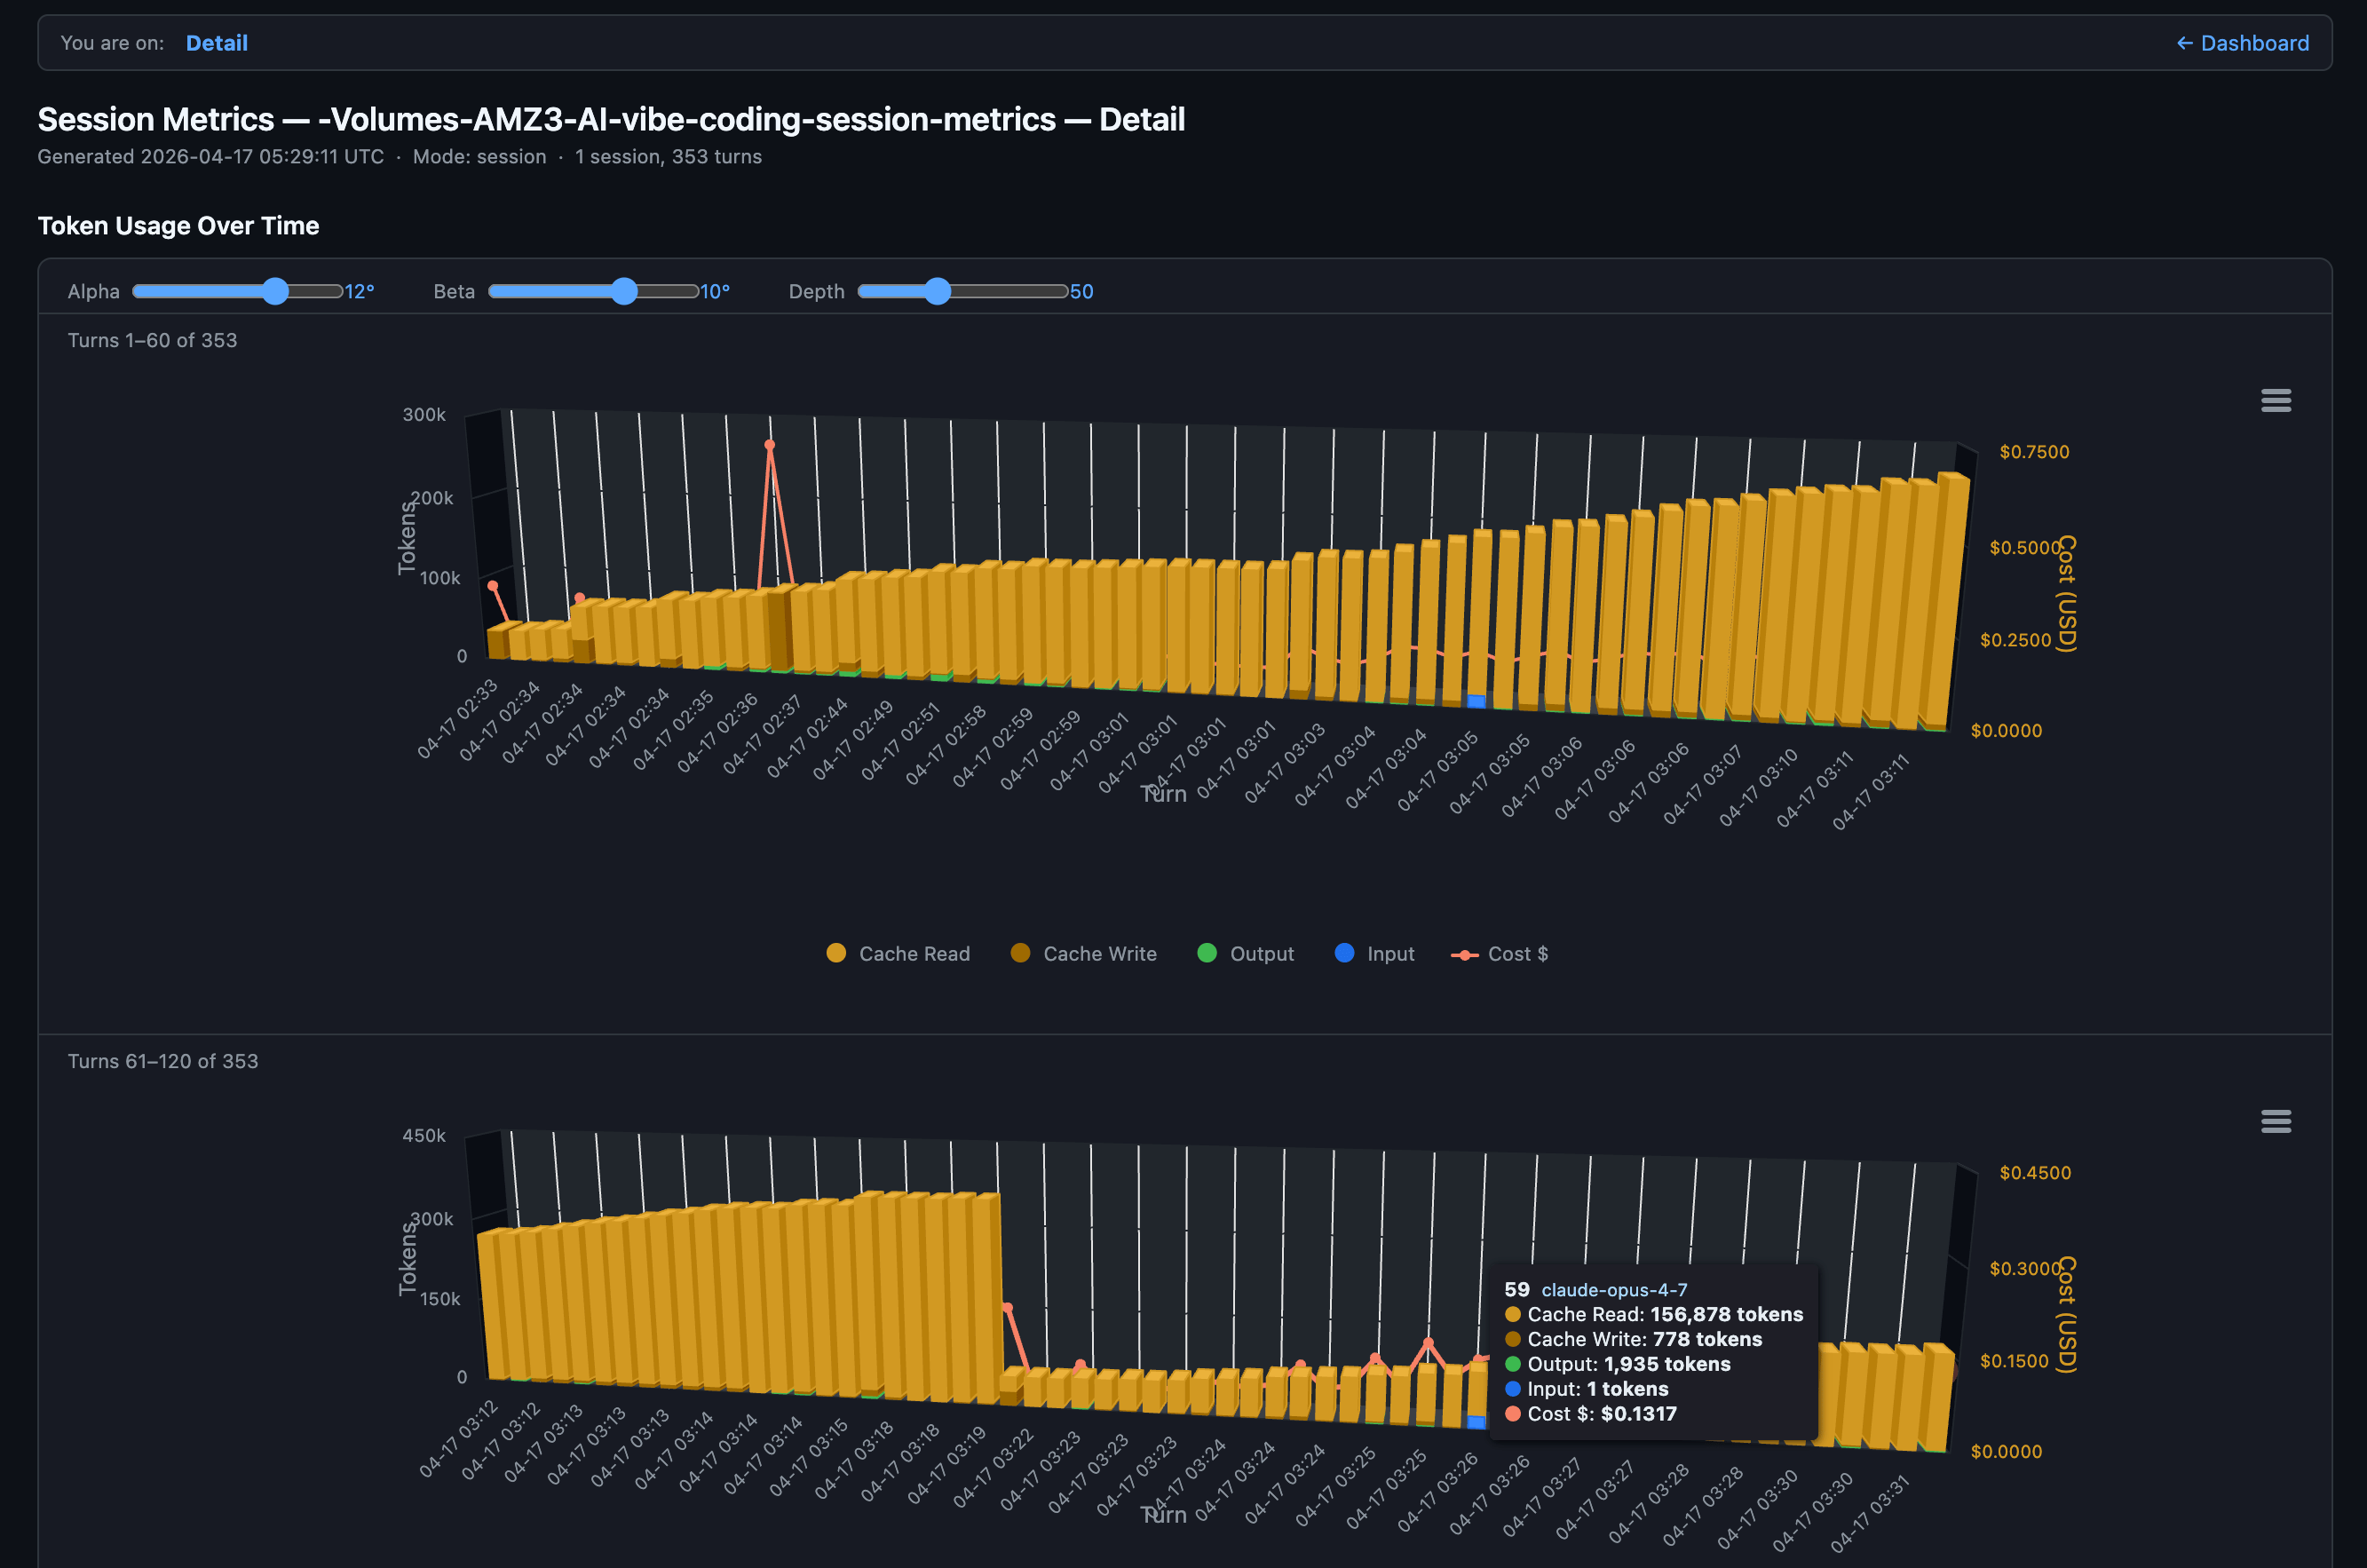
FYI, API splits input into three fields. Total input sent to the model = sum of all three:
Input (new) =
input_tokens(uncached)CacheRd =
cache_read_input_tokensCacheWr =
cache_creation_input_tokens.
And the Claude Code OpenTelemetry Grafana usage dashboard showing the session clearly. Seems Claude Opus 4.7 1 million token window is slight more efficient than Opus 4.6 1 million token window for tokens per $1.
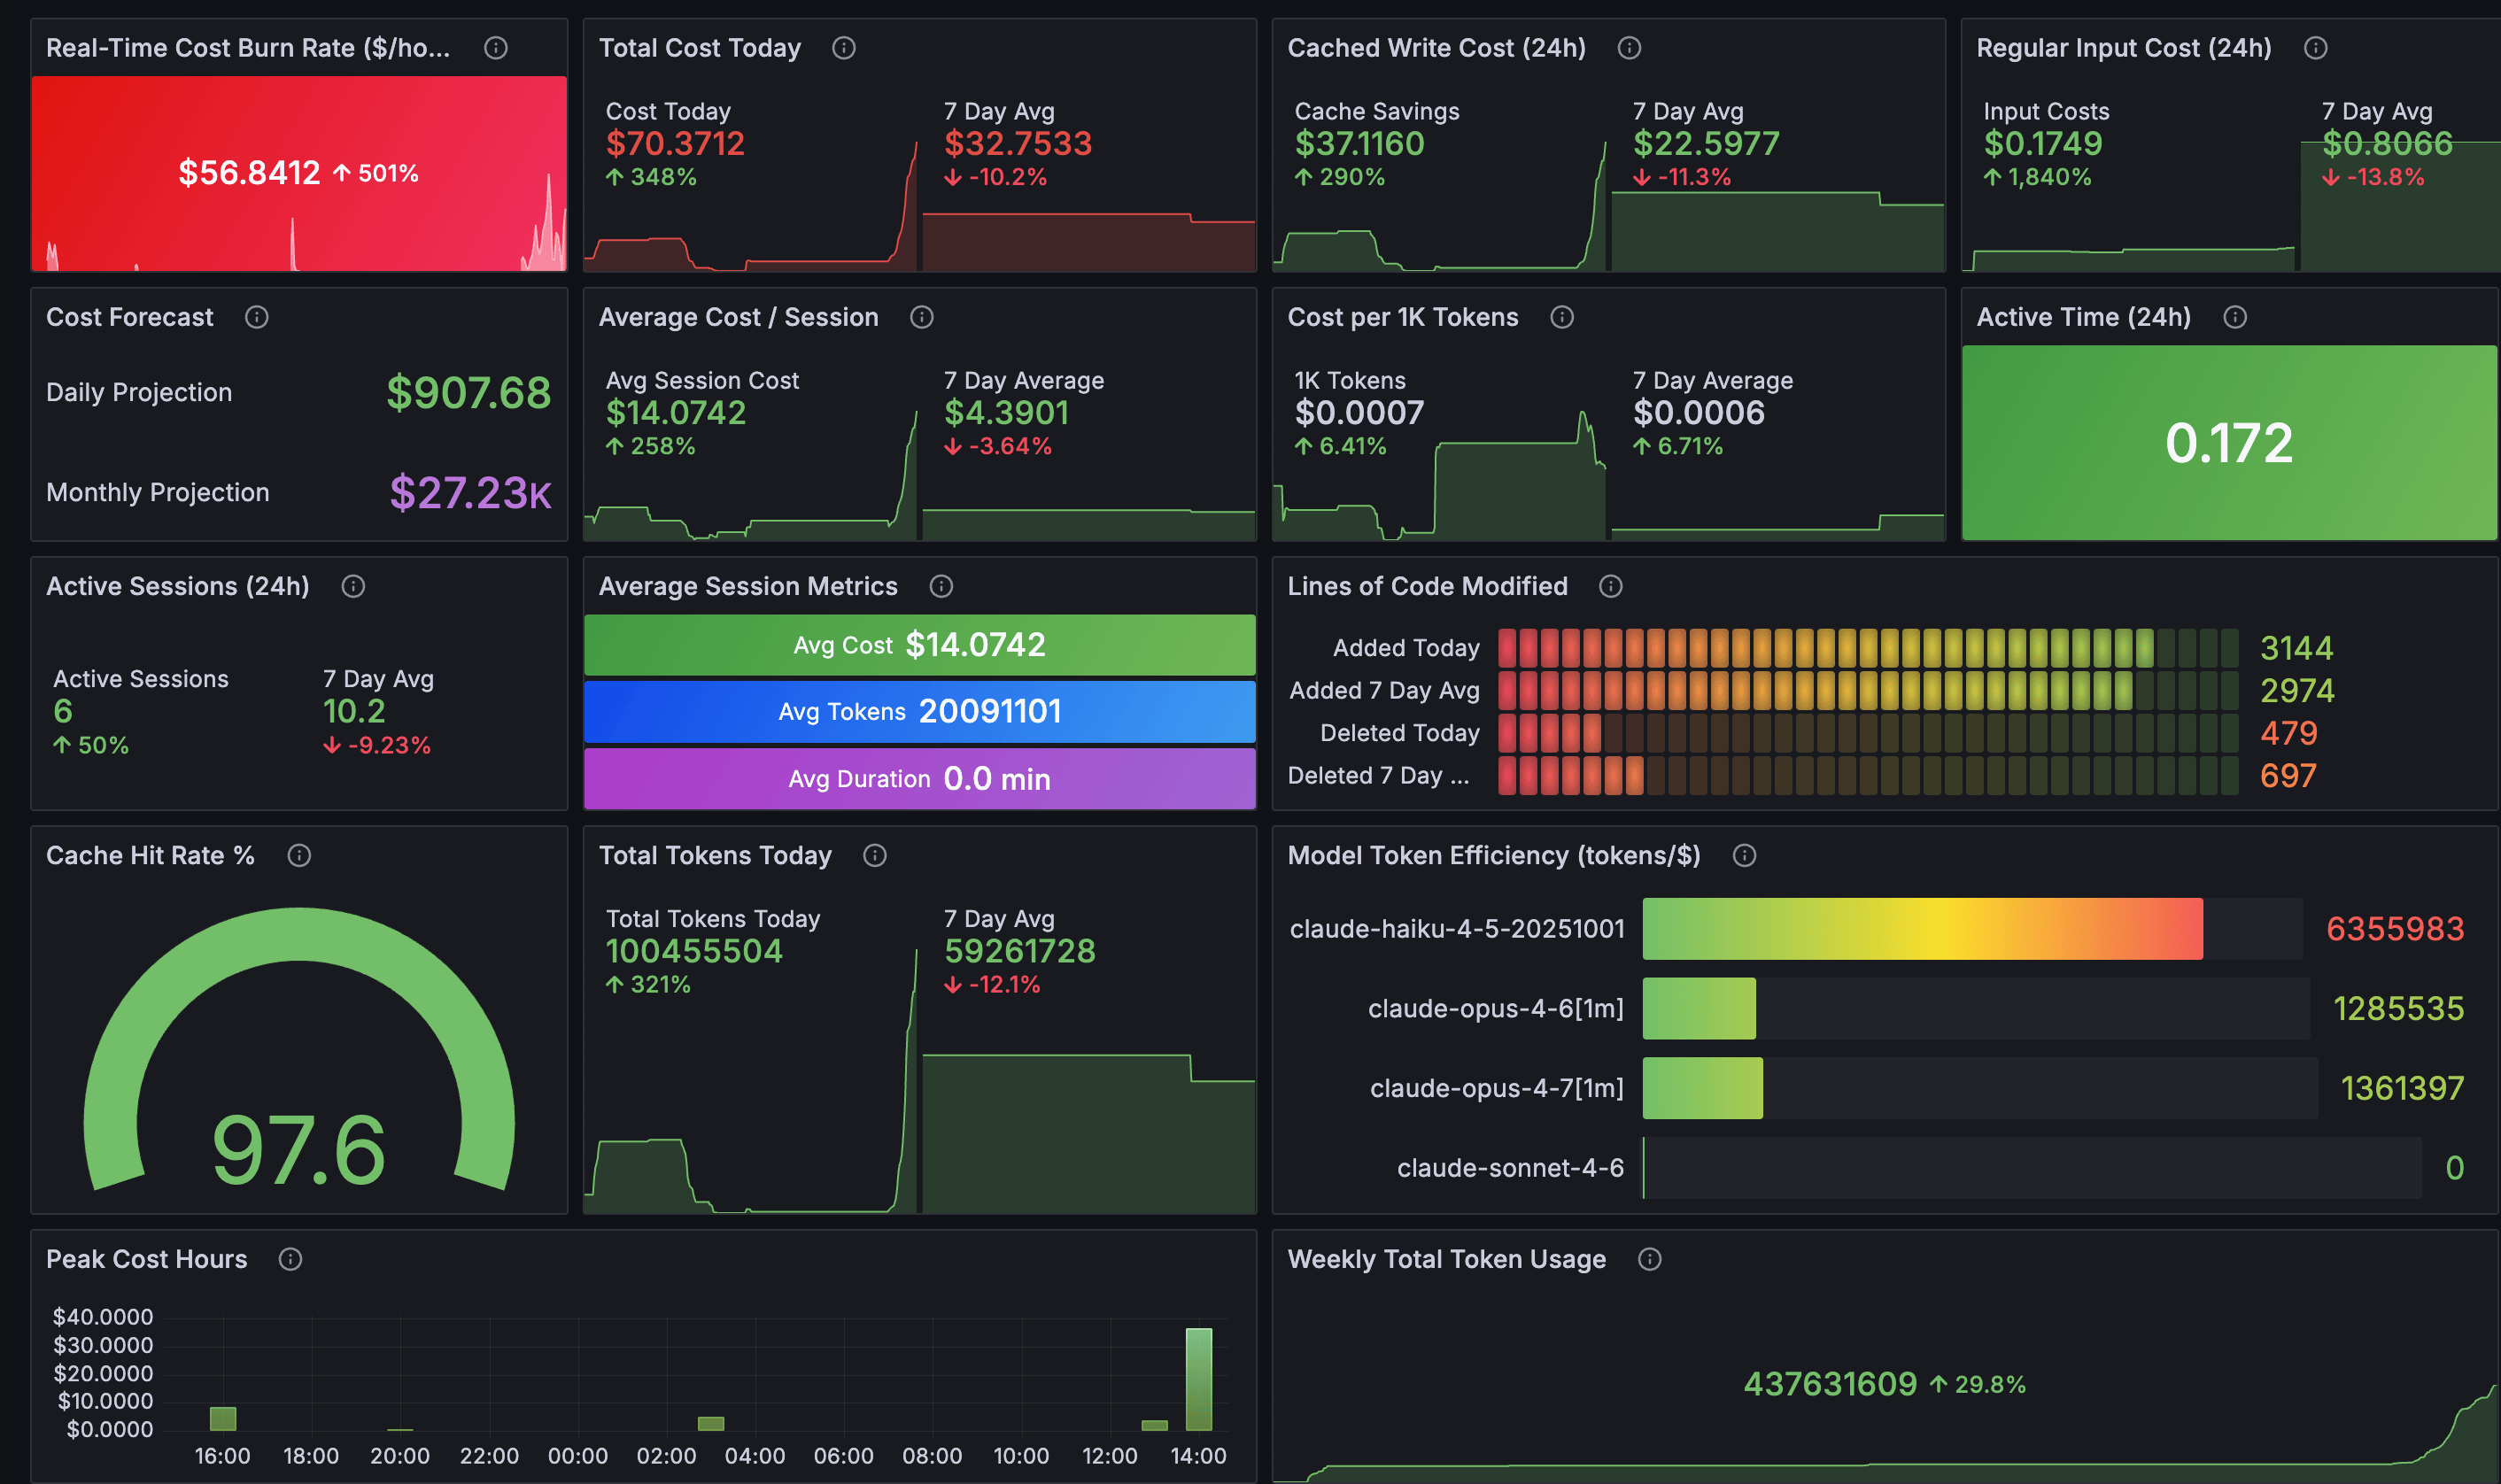
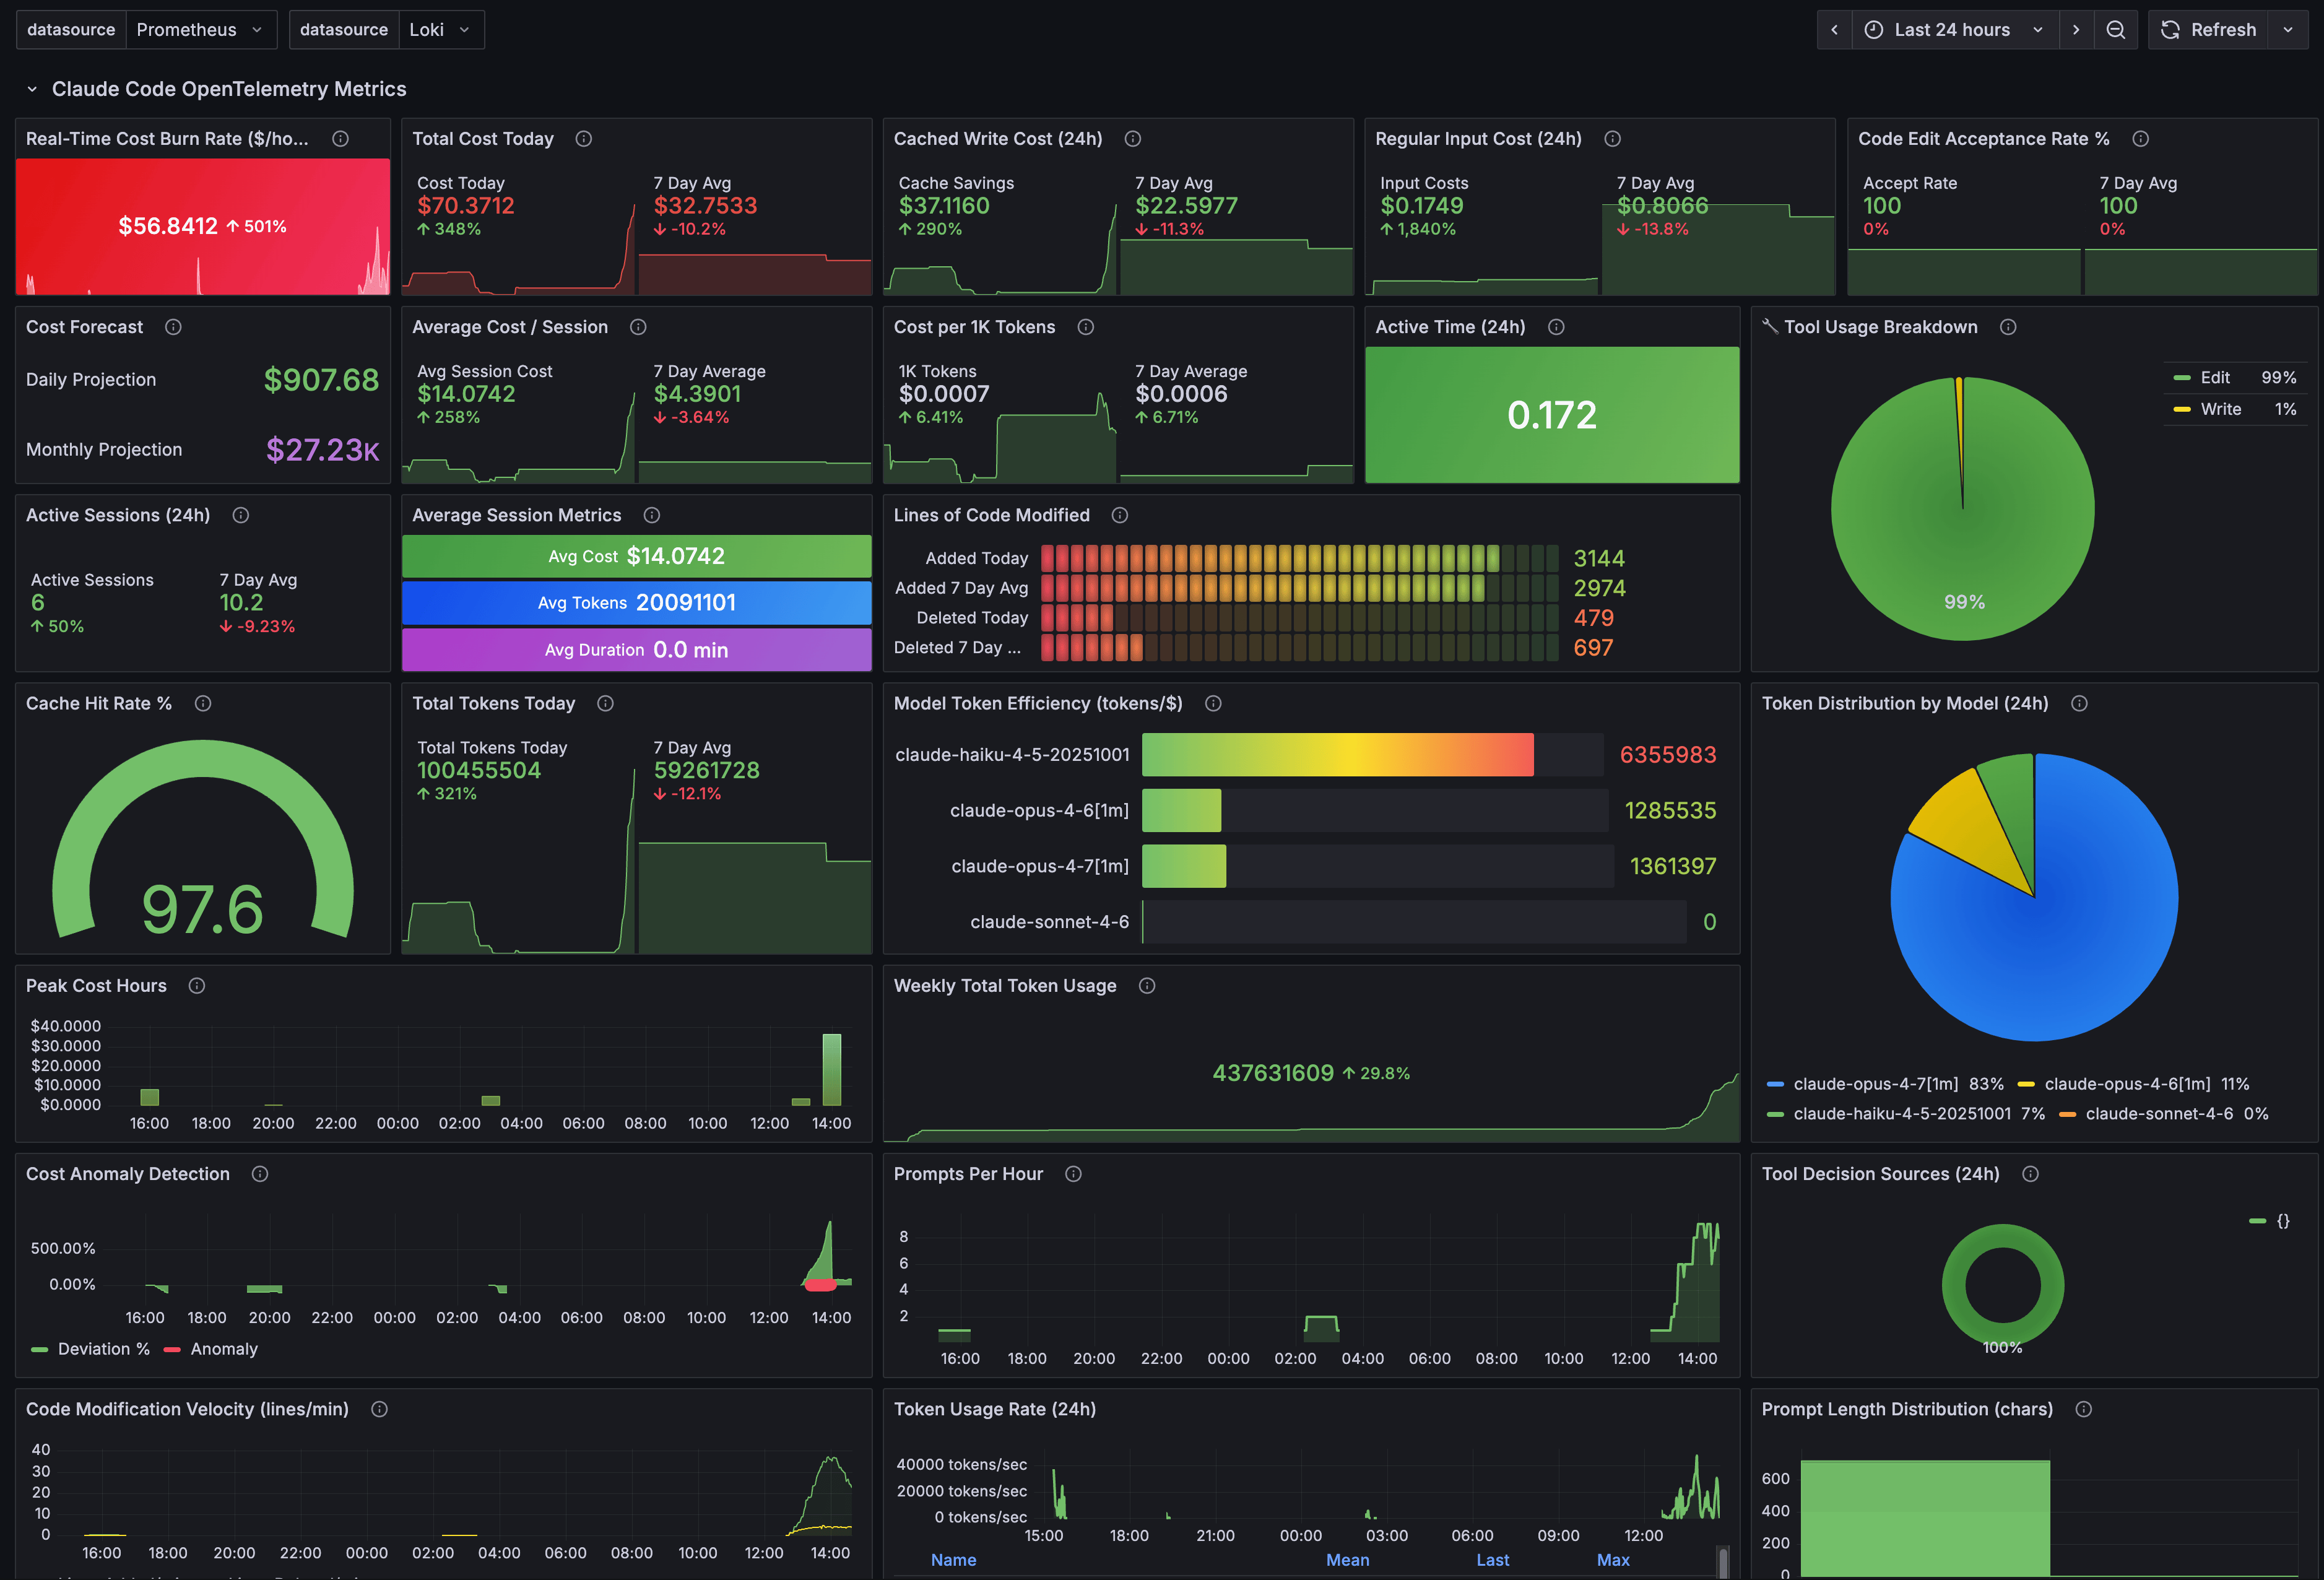
A fuller view of all Grafana dashboard panels.
And Claude AI official usage which includes this chat session and others too.
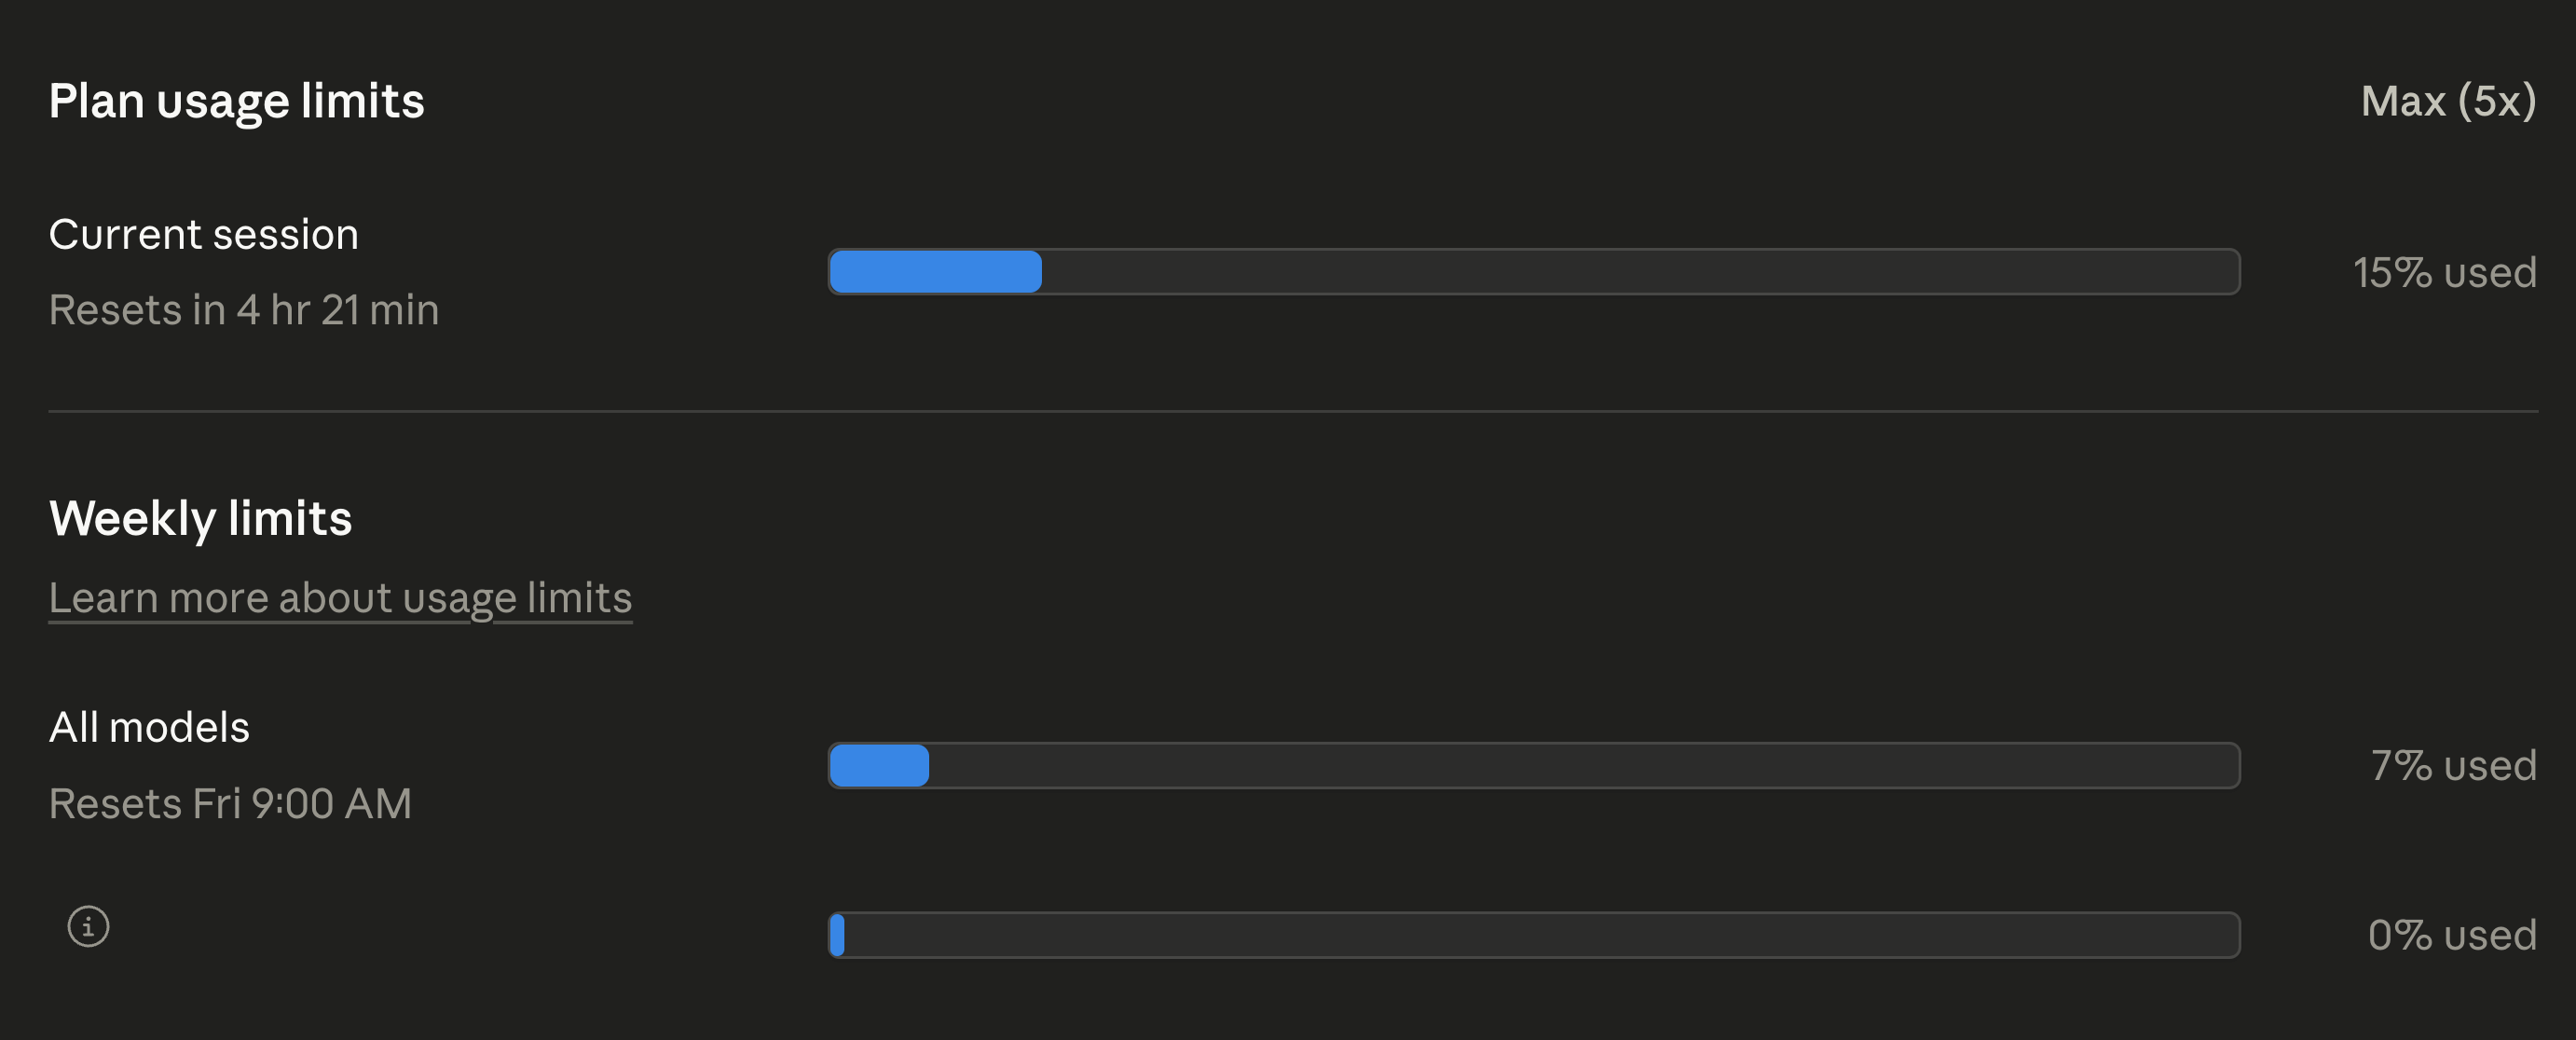
And Claude Code desktop usage metrics after chat sessions.
What’s next
The immediate additions are annotating Claude Code’s peak hours directly on the heatmap and adding more timezone options. Longer term, I want a Cloudflare Worker that serves these reports as a live dashboard instead of static HTML files.
The session-metrics skill isn’t publicly available yet. When it’s publicly available, I will update this article and it will be posted on my Claude Code starter template GitHub repo.
Update: the session-metric skill is now publicly available via my Claude Code plugin marketplace.
If you’re shipping with Claude Code, your cache strategy is your cost strategy. Measure your own usage, find the turns where the cache breaks, and fix the habits that cause it. The data is already on your disk. You just need to read it.
If you want more practical AI building for web apps, dev workflows, and infrastructure, subscribe for future posts. You can also follow shorter updates on Threads (@george_sl_liu) and Bluesky (@georgesl.bsky.social).