
Claude Opus 4.6 vs Opus 4.7 Effort Levels And Prompt Steering Benchmarks
Claude Code benchmarks of 200 headless Claude Code sessions comparing Opus 4.6 and Opus 4.7 1M-context models across effort levels and prompt steering variants - concise, step by step, ultrathink etc

The prompt you prepend to a Claude Code task is doing more than setting tone. On Claude Opus 4.7, it determines whether the model reads files, how much it reasons, and whether it stays within instruction constraints. Anthropic’s Claude Opus 4.7 prompting guide documents this explicitly: the model calibrates to task complexity and lets its extended reasoning be shaped by the prompt. In Claude Code, that “work” is tool calls, file reads, cache writes, and extra agent turns. All of it shows up on the bill. Creator of Claude Code, Boris Cherny also mentioned this in his 6 advice tips.
The benchmarks below compare Claude Opus 4.6 and Opus 4.7 and measured exactly where token usage costs come from (using my session-metrics skill plugin), where instruction-following breaks, and which prompt steering wrappers give you savings without the performance penalty.
The previous tests were for Claude Opus 4.5 vs Opus 4.6 vs Opus 4.7 vs Sonnet 4.6 tested all effort levels from low to max across 10 preset prompts. This time benchmarks focused just on Claude Opus 4.6 [1m] high vs Opus 4.7 [1m] xhigh (respective defaults) across 5 prompt steering variant wrappers around the same 10 preset prompts and measures how well both Claude models faired for instruction following performance and also token usage and costs.
Running these benchmarks with 200 headless Claude Code instances consumed a lot of time and my entire Claude Max $100 plan’s 5hr session limit within 2hrs. If folks find this article useful, please like, restack or share with others. Fortunately, I’ve jumped on voice dictation bandwagon and now use Wispr Flow paired with DJI Mic Mini and more than doubled my typing speed. If you haven’t tried Wispr Flow yet, sign up here and get a free month on their Pro plan.
The result
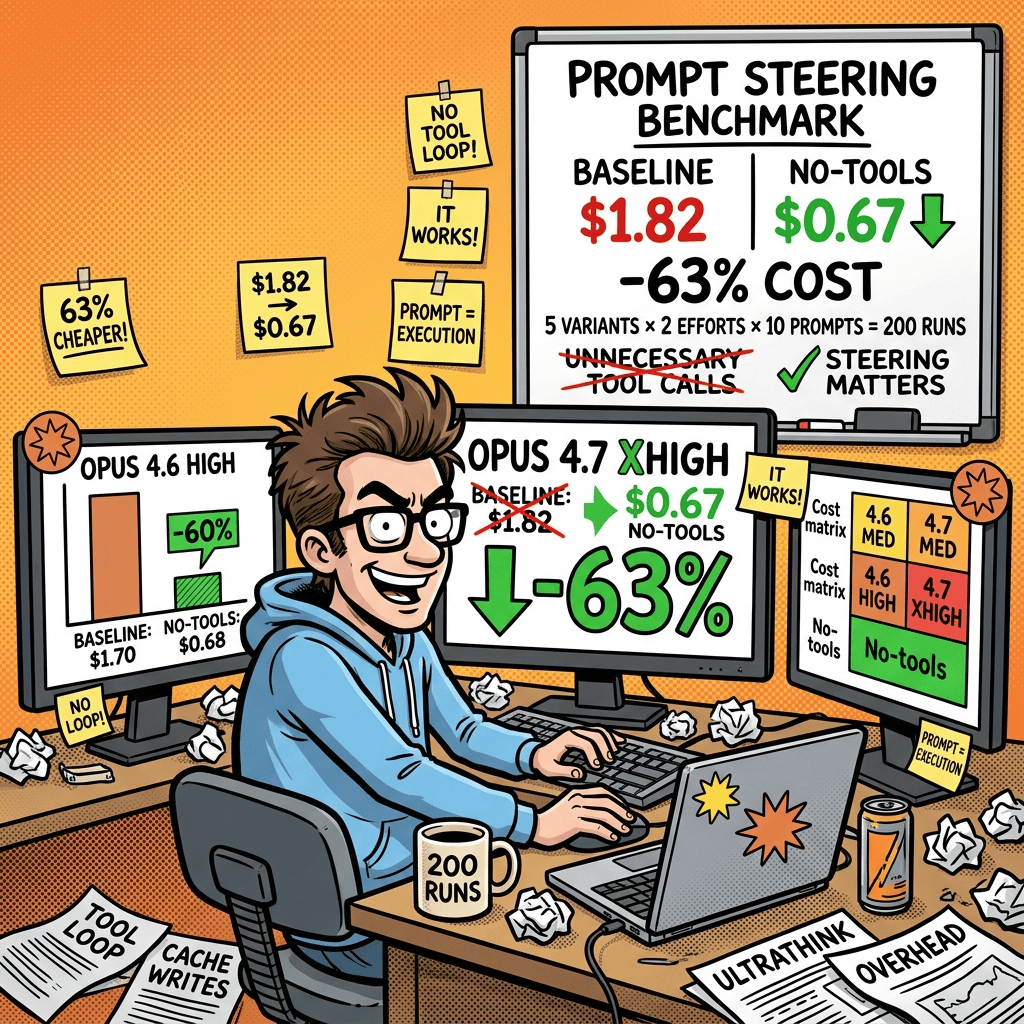
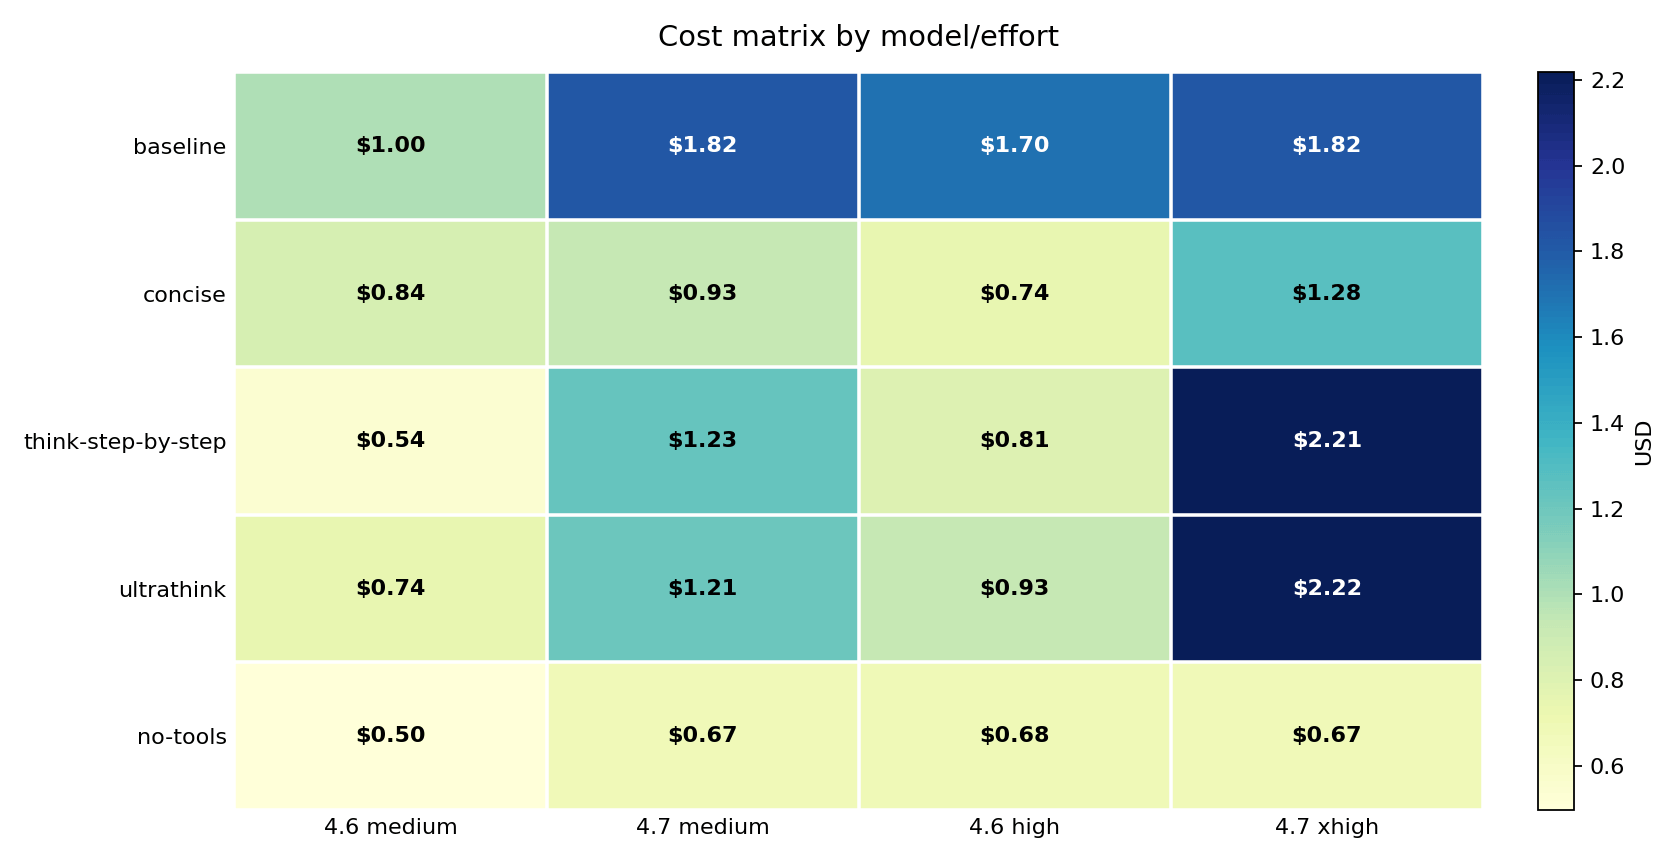
Prepend one sentence before every prompt and your Claude Code bill drops 63 percent. Do not invoke any tools. Answer from your own knowledge and reasoning only. moved the same 10 prompts from $1.82 to $0.67 on Opus 4.7 xhigh. Opus 4.6 high followed almost exactly: $1.70 to $0.68, a 60 percent reduction.
That same sentence cut Opus 4.7’s instruction-following from 8/9 to 6/9. The model stopped completing 2 of 9 prompts correctly – every failure on a task that required reading a file the model could no longer access. The cost saving is real. So is the performance drop.
Prepend a different sentence – Think harder and more thoroughly about this problem. Use extended reasoning before responding. – and cost goes the other direction: $1.82 to $2.22, a 22 percent increase on Opus 4.7 xhigh, with instruction-following unchanged at 8/9. More expensive. No better at following instructions.
Opus 4.6 high responded to the same two wrappers in the opposite direction: think-step-by-step and ultrathink cut cost on 4.6 while raising it on 4.7. Instruction-following on 4.6 held 9/9 across all five variants.

TL;DR
no-toolscut cost by 63 percent on Opus 4.7 xhigh ($1.82 to $0.67) and 60 percent on Opus 4.6 high ($1.70 to $0.68). It was the strongest cost reducer in every model and effort cell.no-toolsalso carried the steepest performance penalty. Opus 4.7 dropped from 8/9 to 6/9 on IFEval (instruction-following pass rate) at both effort levels. Three prompts drove every failure: the session-opening file summary, stack trace debugging, and TypeScript refactoring – all tasks that require reading files the model can no longer reach. Opus 4.6 was unaffected at high effort; at medium it lost one pass on the same file-summary prompt.think-step-by-stepandultrathinkincreased cost on Opus 4.7 xhigh by about 22 percent each – with no IFEval improvement over baseline. The same wrappers cut cost on Opus 4.6 high. Same sentence, opposite effect, different model.ultrathinkwas the worst latency offender: Opus 4.7 xhigh wall-clock grew 79.2 percent, and output tokens roughly doubled (+97.8% across the benchmark). No instruction-following gain over baseline justified either penalty.concisecut Opus 4.6 high cost by 56.3 percent with IFEval holding at 9/9 – no regression, no tool suppression. On Opus 4.7 xhigh it dropped cost 29.8 percent with IFEval holding at 8/9. On Opus 4.7 medium the savings reach 48.9 percent. It is the first wrapper to test when tools cannot be suppressed.no-toolssaved money even when it produced longer answers. Opus 4.6 high output tokens went up 11 percent, but cost fell 60 percent. Output length is not the main cost driver – cache writes and tool loops are.The cost difference between variants is almost entirely explained by when and where cache writes happened, not by how long the final answer was. Instruction-following (IFEval) and cost do not always move together –
no-toolsis the sharpest example: lowest cost, lowest instruction-following on Opus 4.7.The IFEval section below breaks down in detail how Opus 4.6 and Opus 4.7 performed in terms of instruction following across the tested effort levels and prompt steering wrappers and does show some regressions for Opus 4.7 for some prompt steering variants. Some prompt steering variants did help improve Opus 4.7 which is inline with Anthropic’s official statements.
What I tested
I ran 200 headless Claude Code sessions:
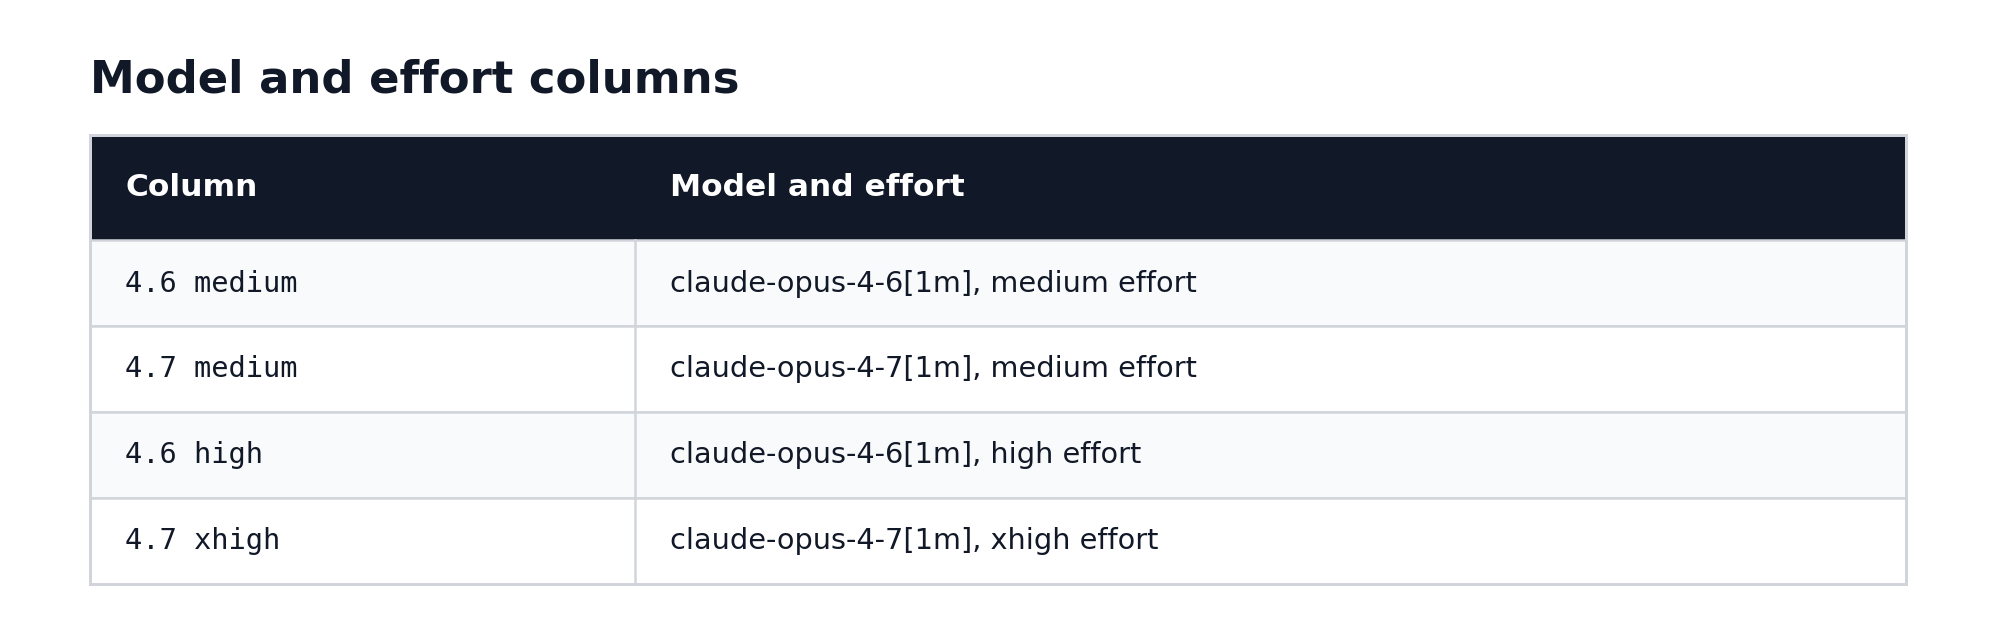
5 prompt variants x 2 effort anchors x 2 model sides x 10 prompts = 200 runsThe two model sides compared Opus 4.6 at high effort against Opus 4.7 at xhigh effort, and both models at medium effort. xhigh is an Opus 4.7-only effort rung – Opus 4.6 tops out at high. That asymmetry is intentional: the goal was to compare each model at its natural operating point for heavier tasks.
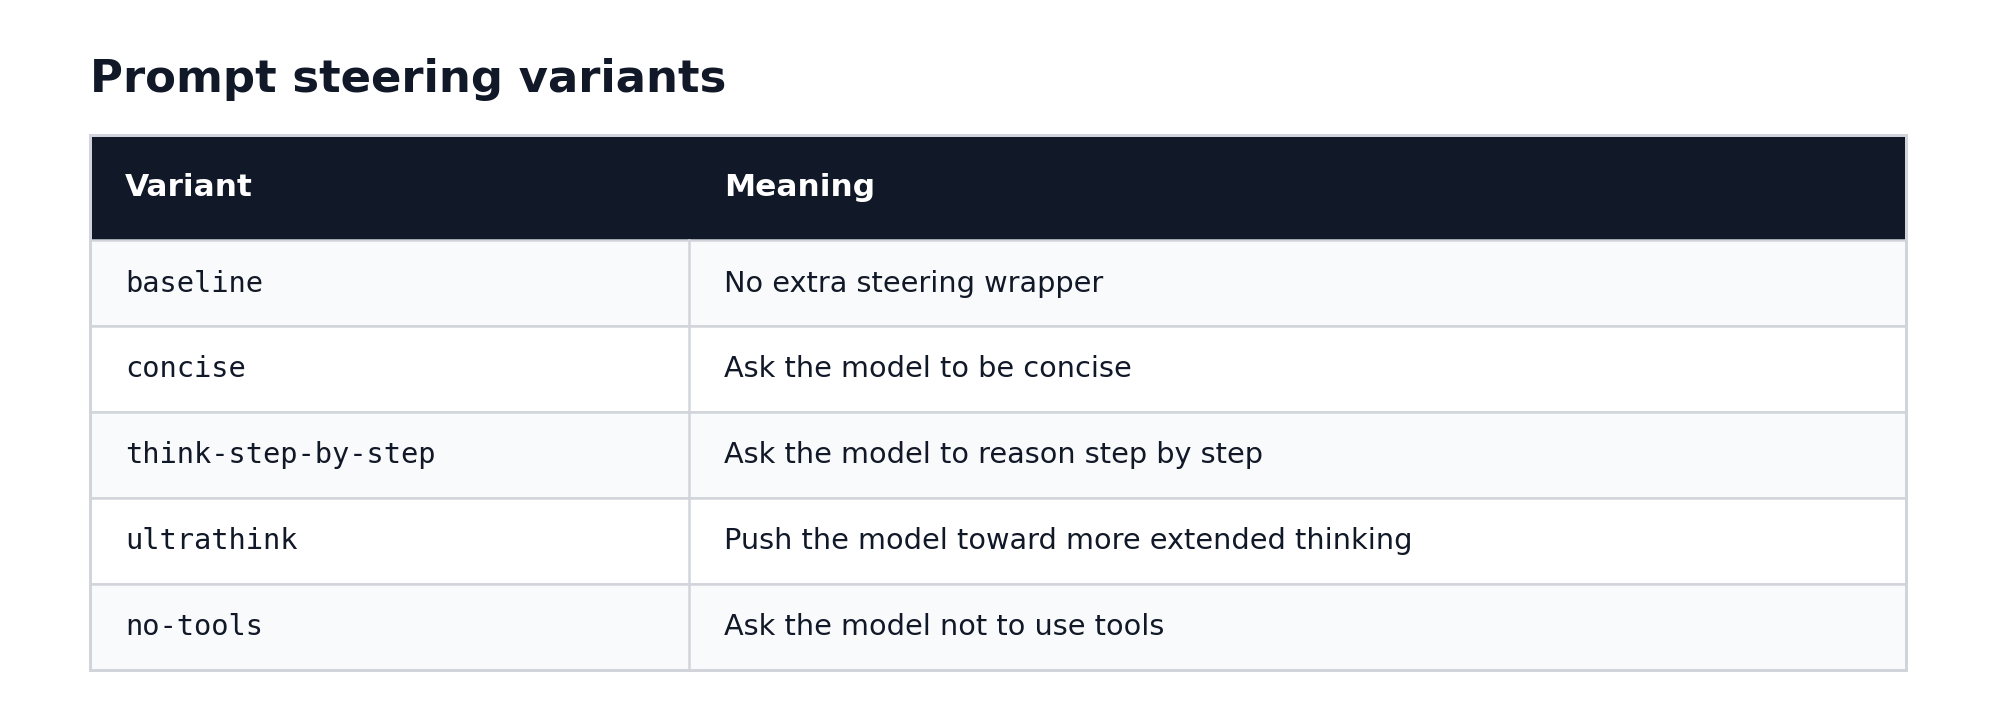
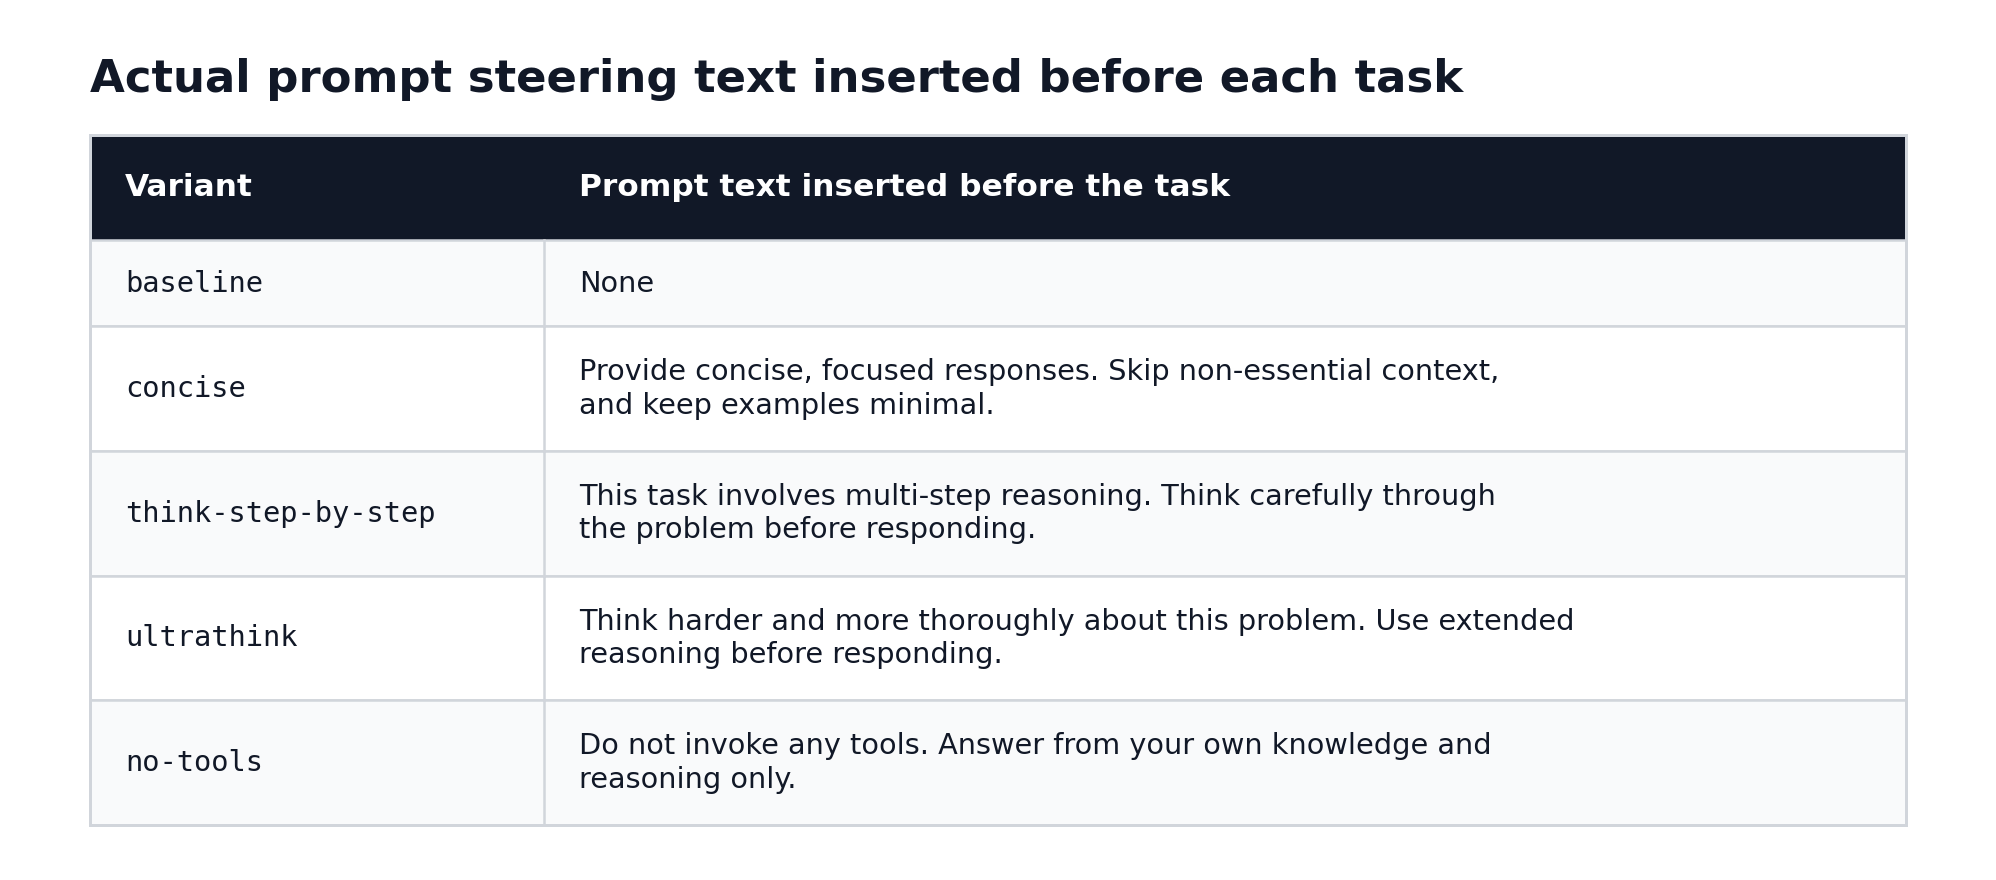
The five steering variants were a sentence prepended to each prompt before it ran. Baseline left the prompt unchanged.
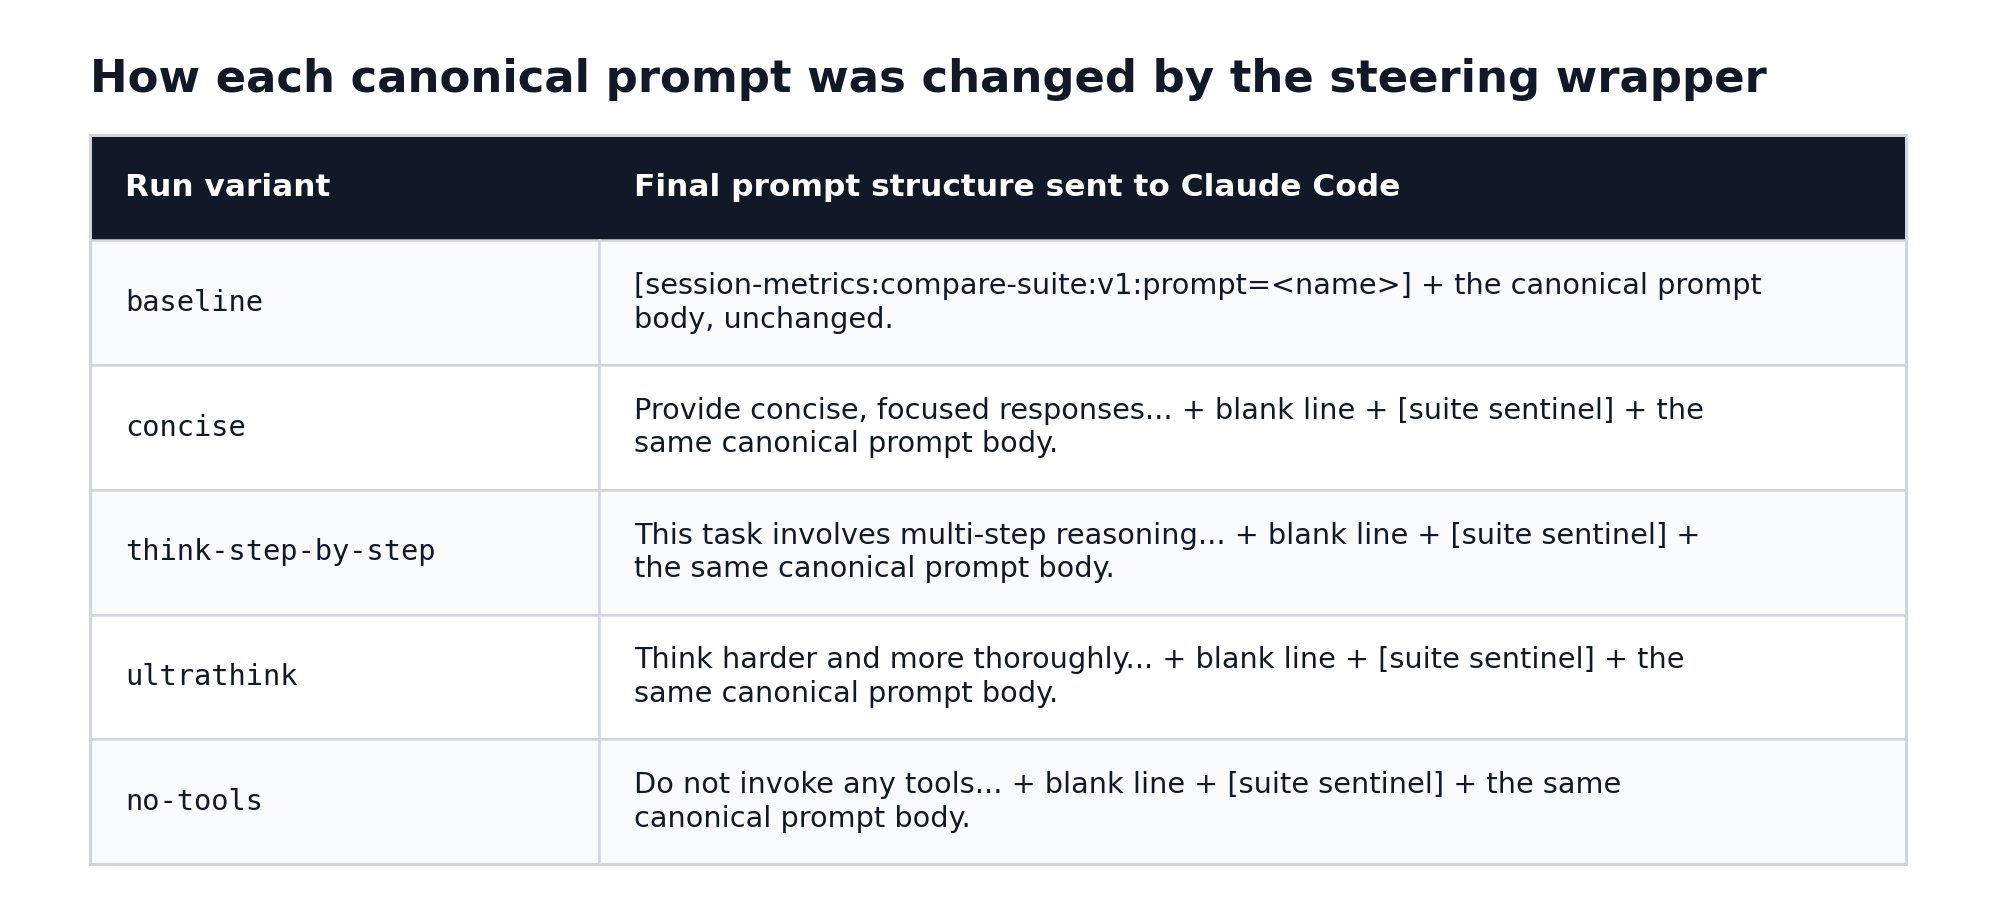
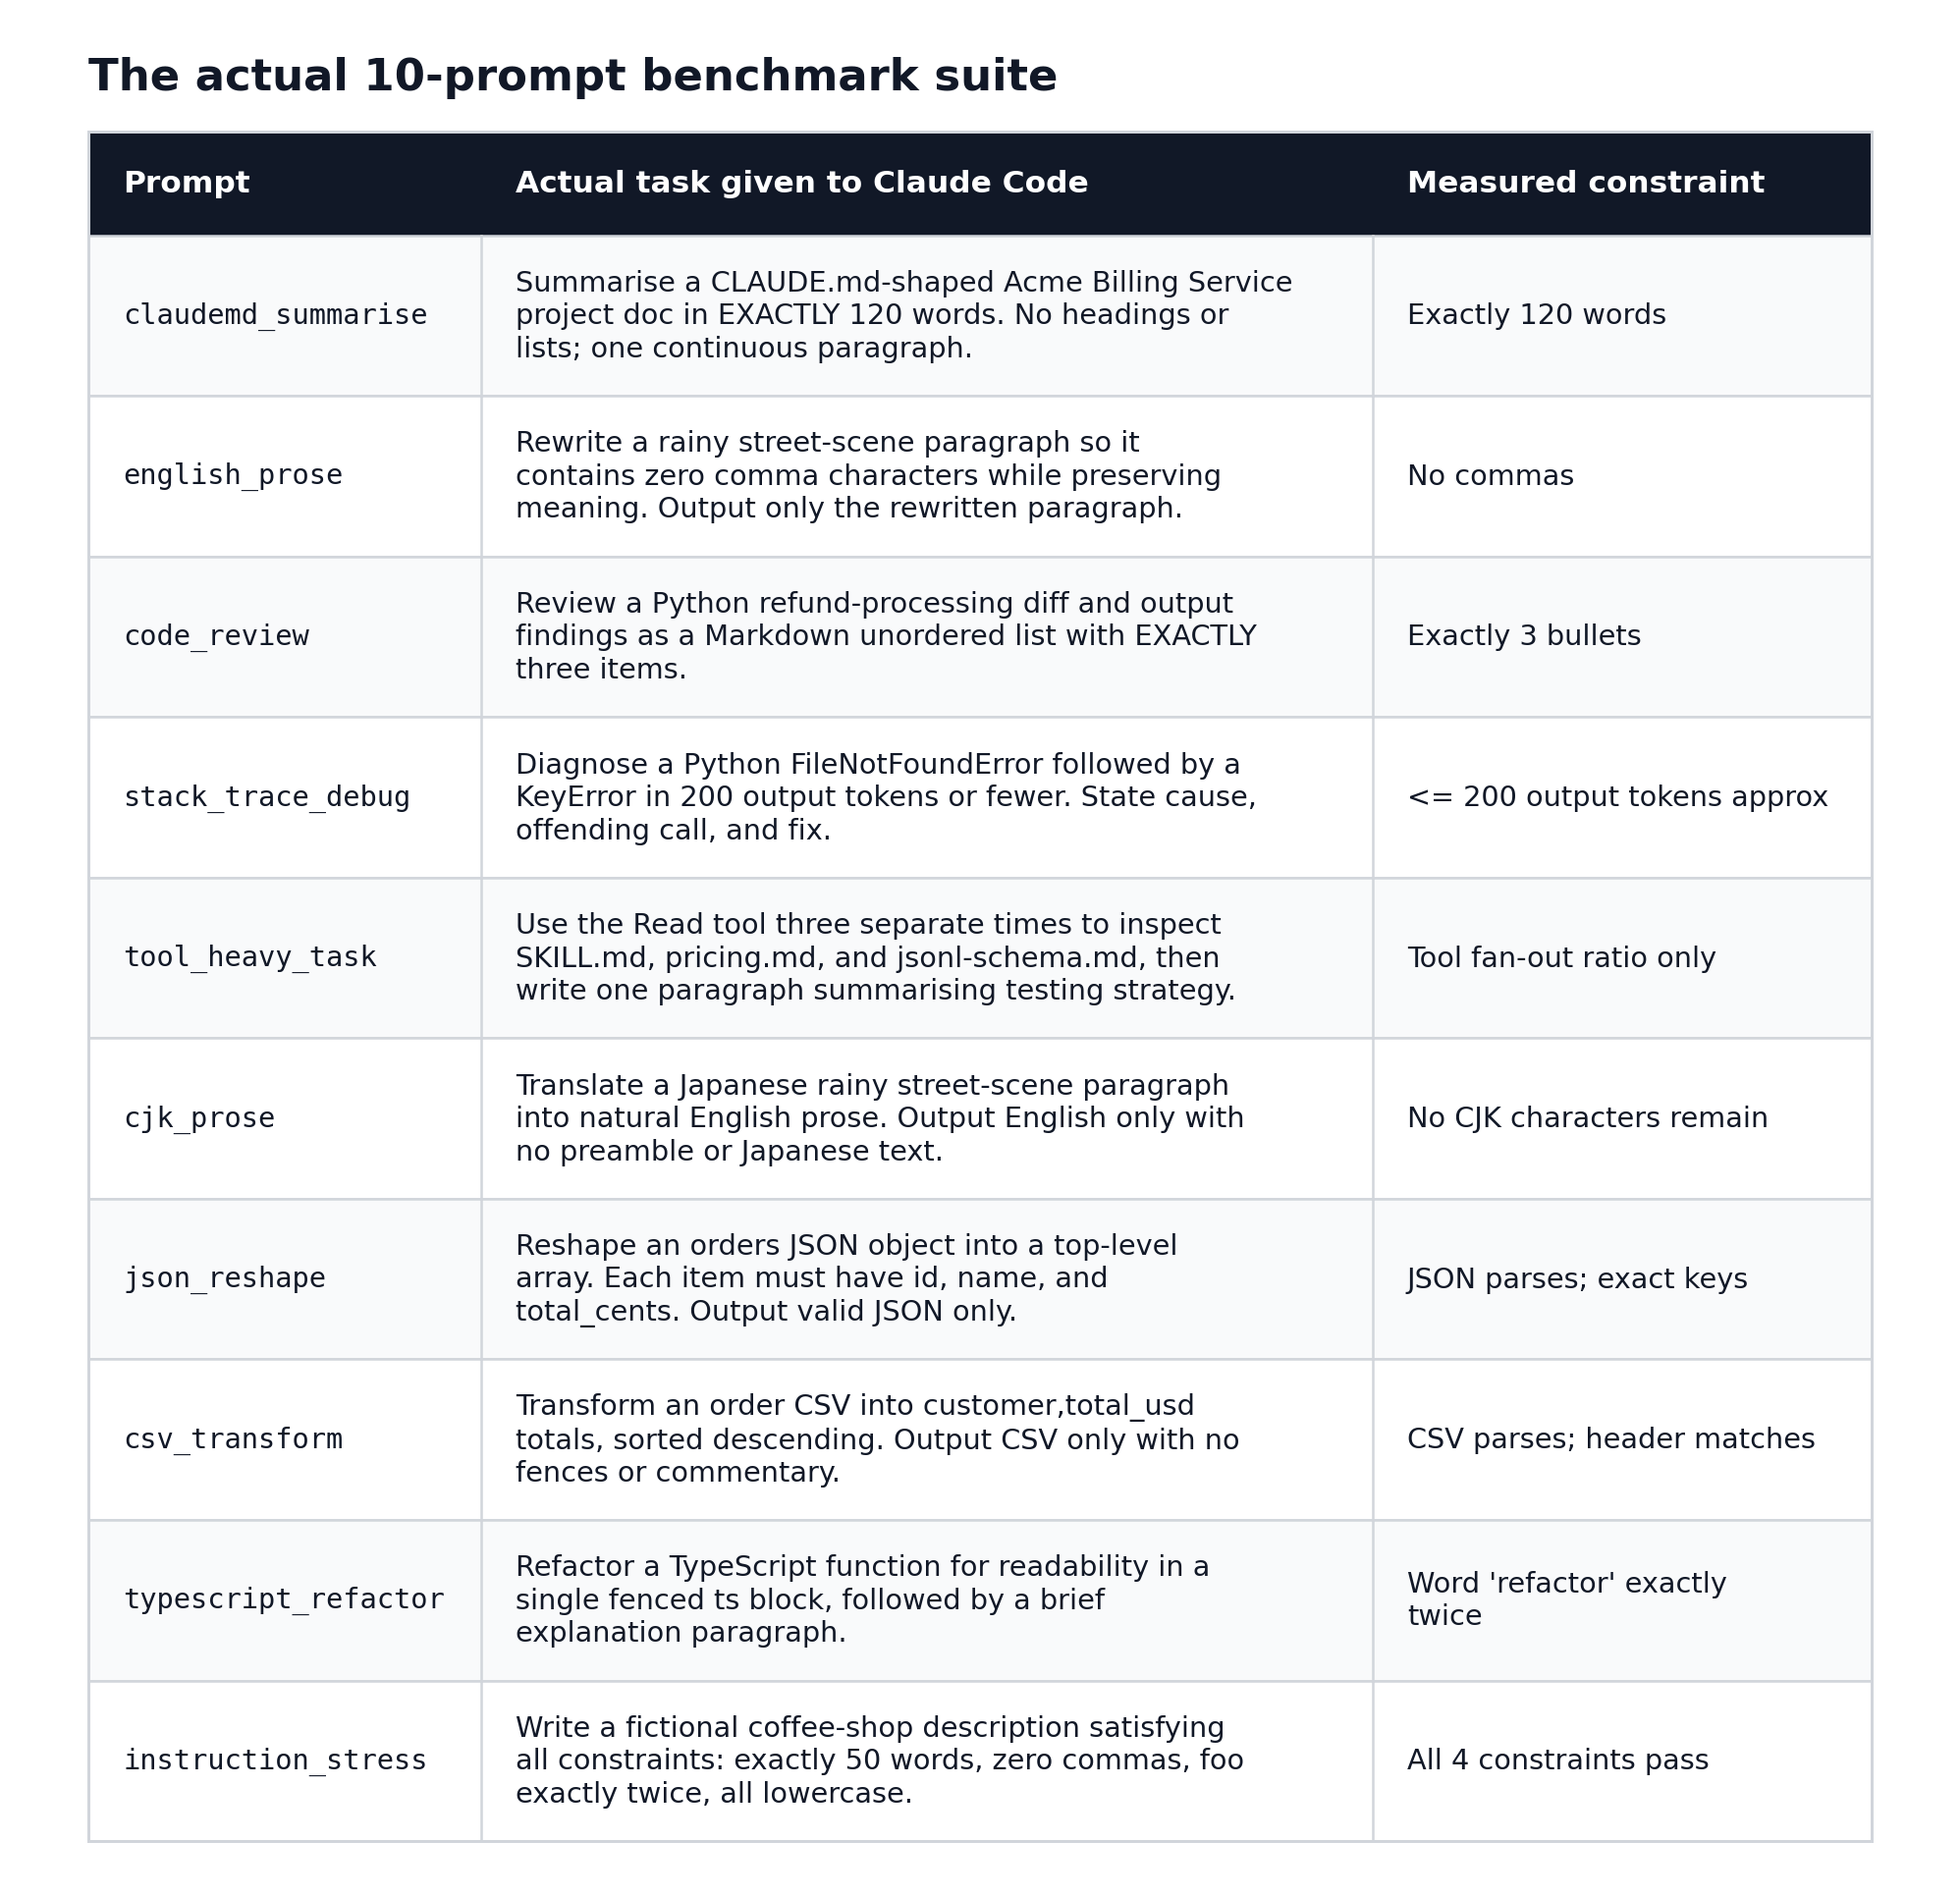
The 10-prompt suite was deliberately mixed: prose writing, code review, stack trace debugging, JSON reshaping, CSV transformation, CJK translation, TypeScript refactoring, instruction-following under multiple simultaneous constraints, and one task that explicitly required three separate file reads.
This is not a general model leaderboard. It is a Claude Code workflow benchmark. The question was: what happens to cost, latency, and instruction-following when you change the model, the effort level, and the steering text around the same task suite?
The four numbers I would remember
If you only take one thing from this benchmark, take this:
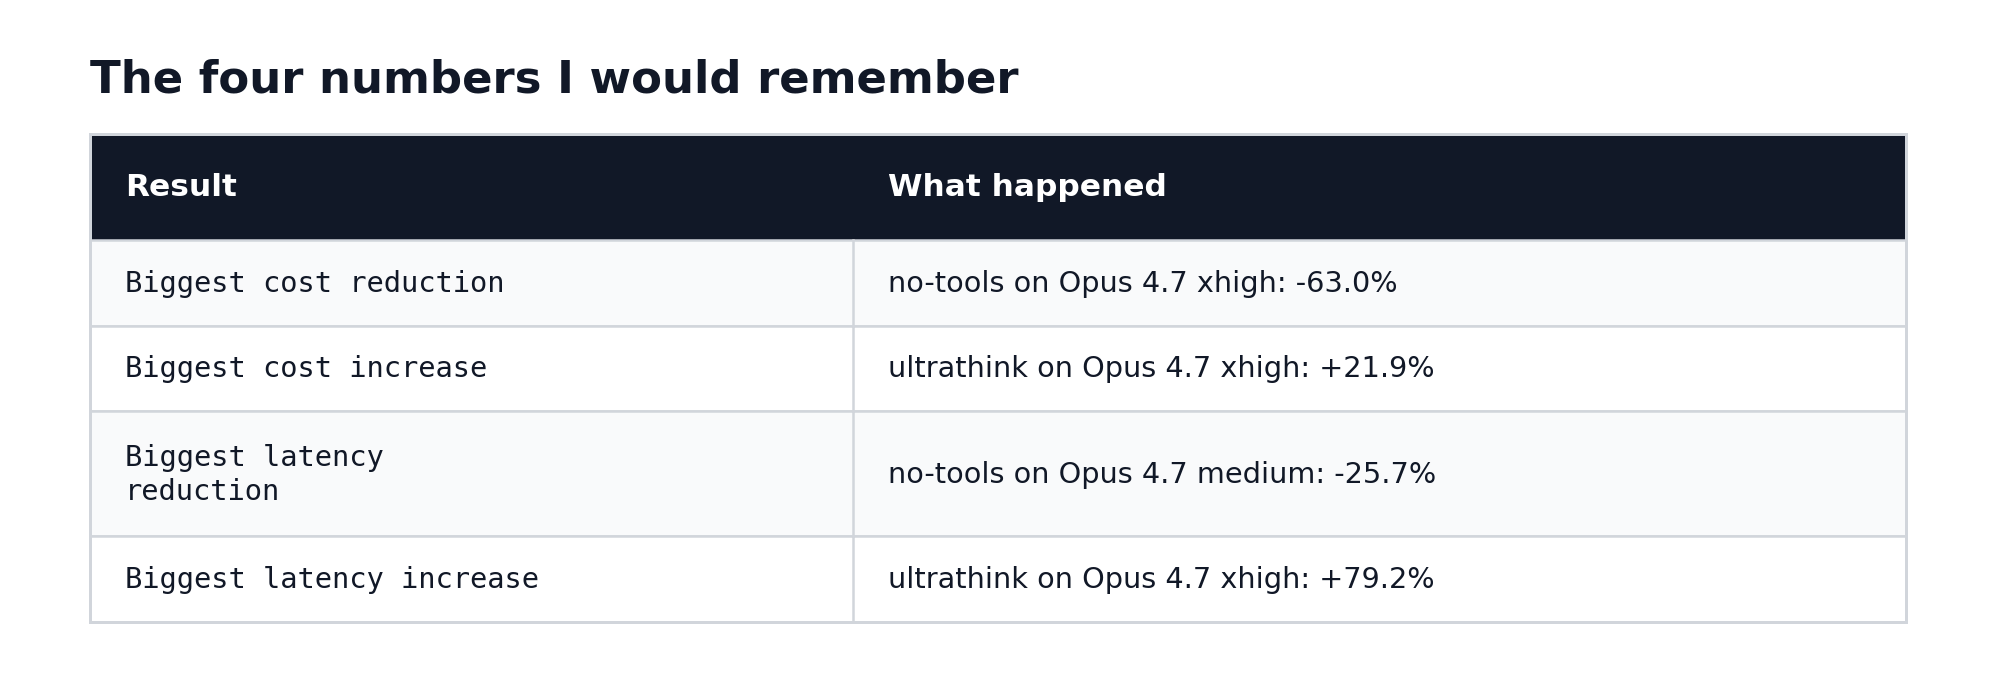
Both high-effort models – Opus 4.6 high and Opus 4.7 xhigh – landed at nearly the same cost under no-tools, despite starting from different baselines. The steering wrapper did not just shorten the answer. It changed the entire shape of the session.
If a Claude Code task does not need to read files, run shell commands, or make tool calls, prompt suppression is a bigger cost lever than effort tuning.
Why this matters for Opus 4.7
With older Opus models, I could often write a broad prompt and trust the model to self-regulate. Ask it to review some code and it would spend roughly the right amount of effort on it.
Opus 4.7 is more responsive to the prompt – which cuts both ways. It can do more with a well-specified task. But it can also spend significantly more on a vague one. Because it adapts its reasoning depth and response length more actively than its predecessors, the prompt has to carry the intent that used to be implicit.
If I want a concise answer, I should say so. If I do not want tool calls, I should say so. Those instructions do not just change tone. In this benchmark, they changed cost, latency, cache writes, tool-use counts, and thinking-block counts.
Cost: the clearest signal
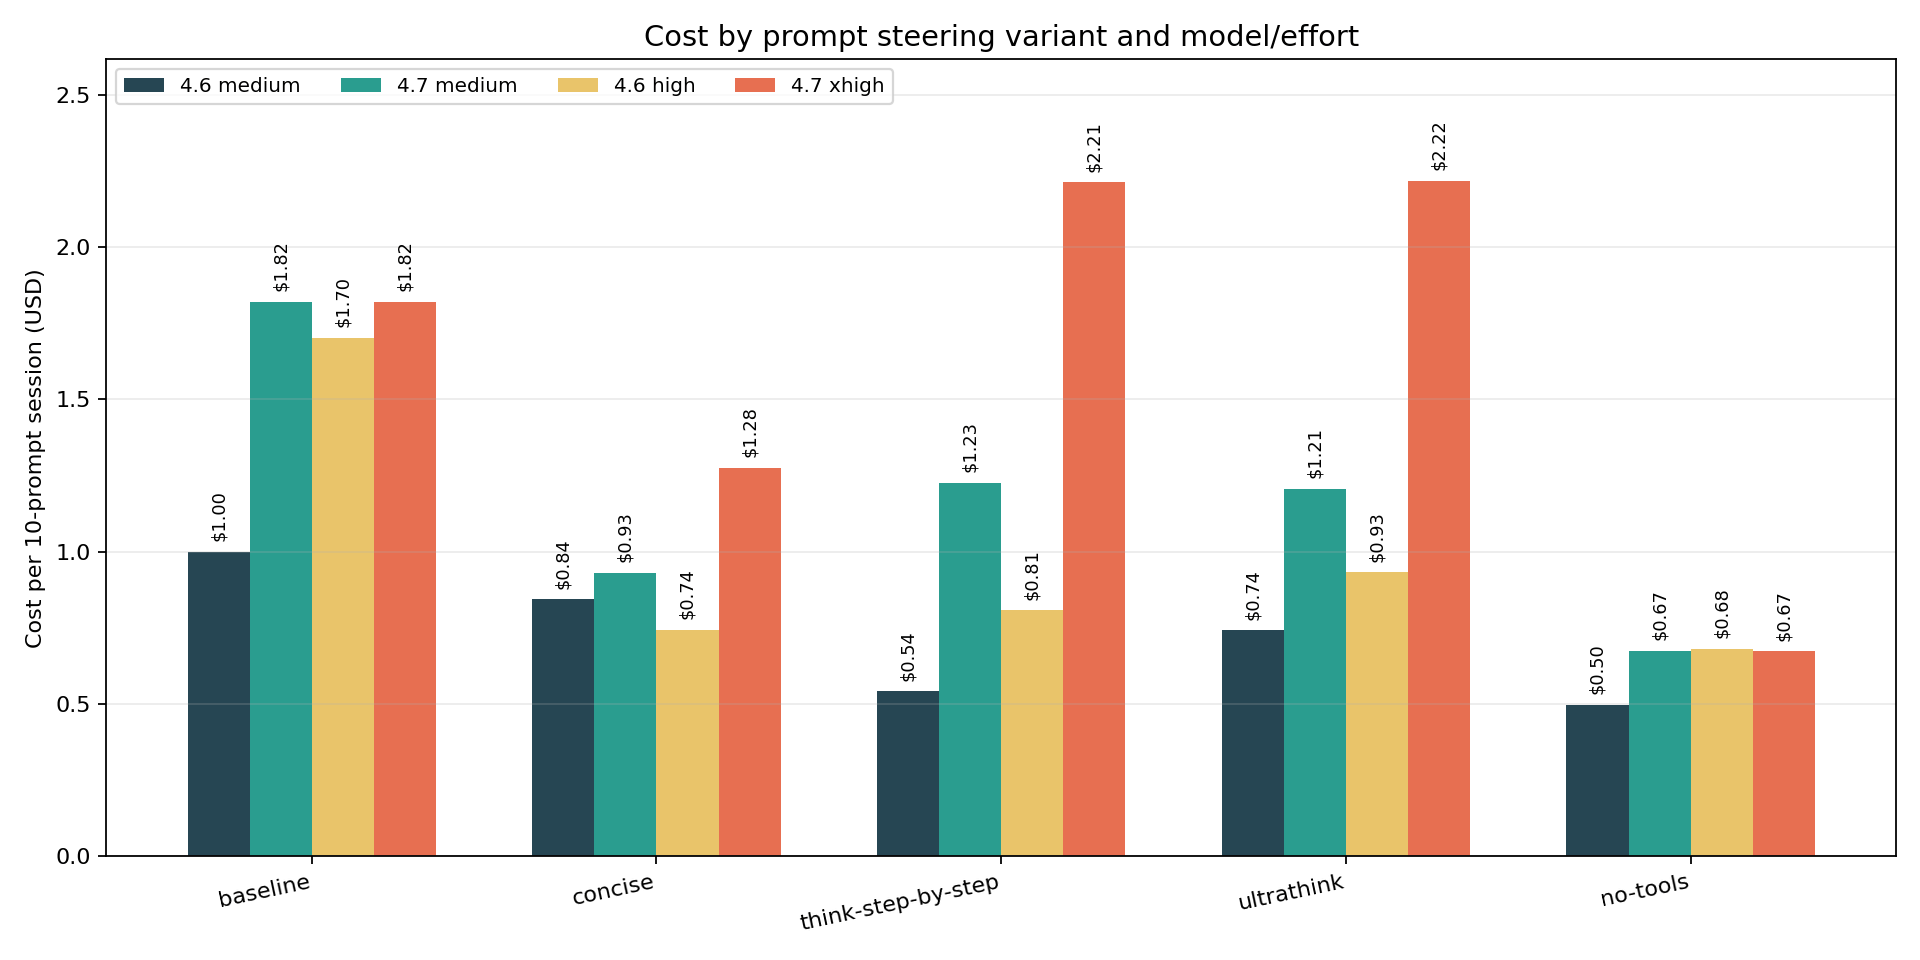
The cheapest path was not “always use lower effort.” It was “avoid tools when tools are not needed.” no-tools produced the lowest or near-lowest cost in every model and effort cell: $0.50, $0.67, $0.68, $0.67. At the high/xhigh anchor – the most practically relevant comparison – Opus 4.6 high settled at $0.68 and Opus 4.7 xhigh at $0.67. Effectively the same cost, from two models that started at $1.70 and $1.82. But cost convergence masked an instruction-following divergence: at that same $0.68/$0.67 cost point, Opus 4.6 held 9/9 IFEval and Opus 4.7 dropped to 6/9. The savings are real. The performance drop on 4.7 is also real.
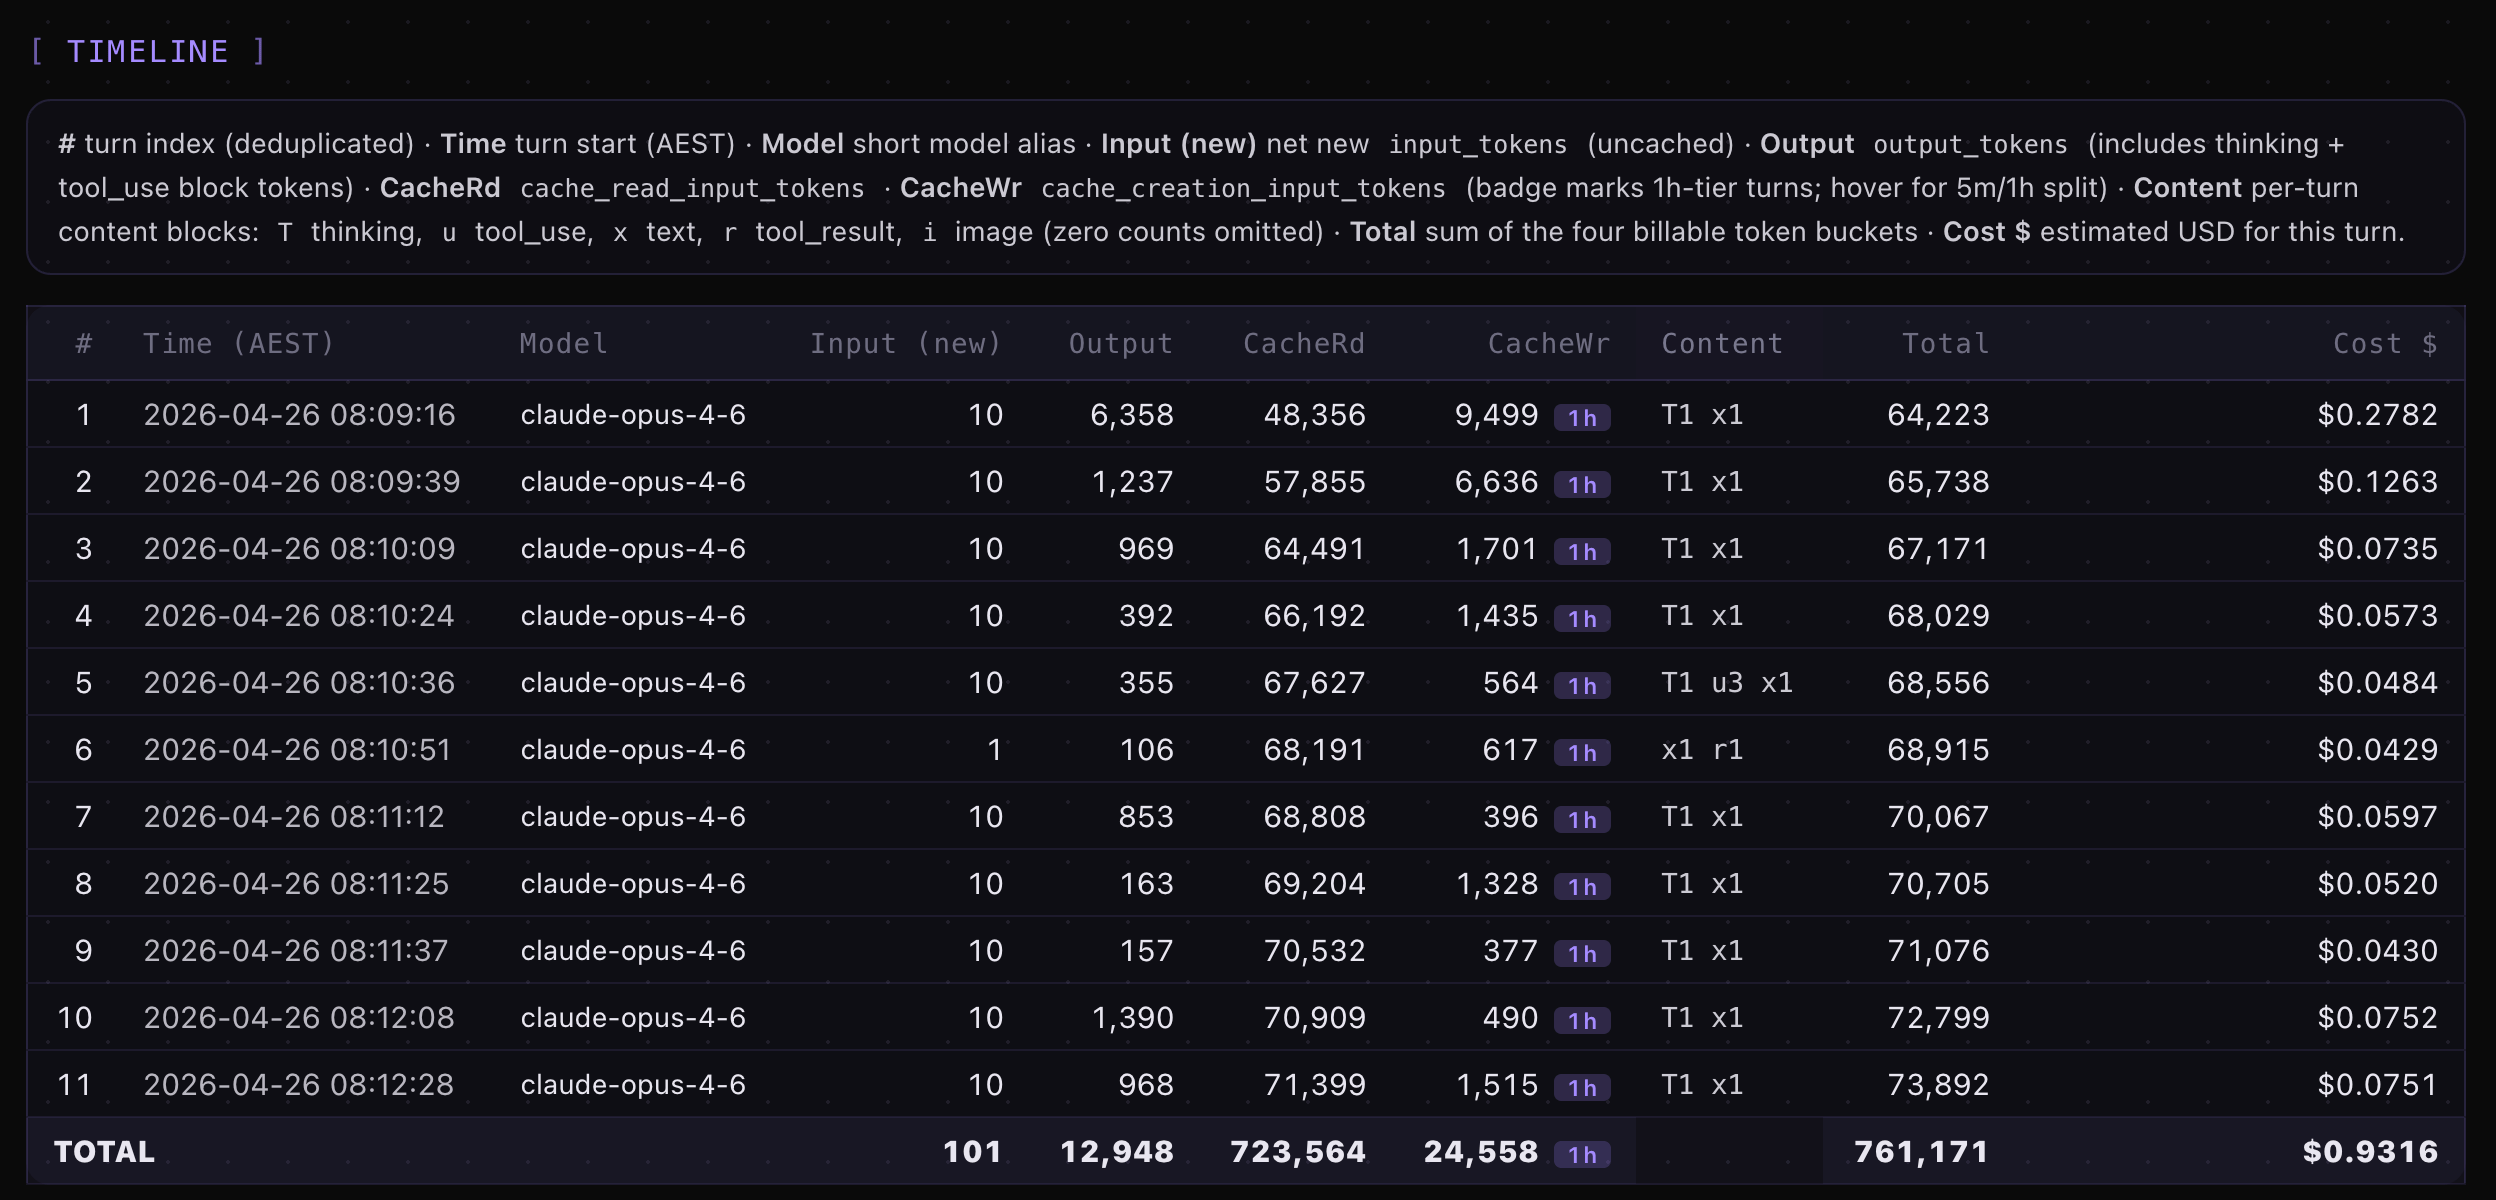
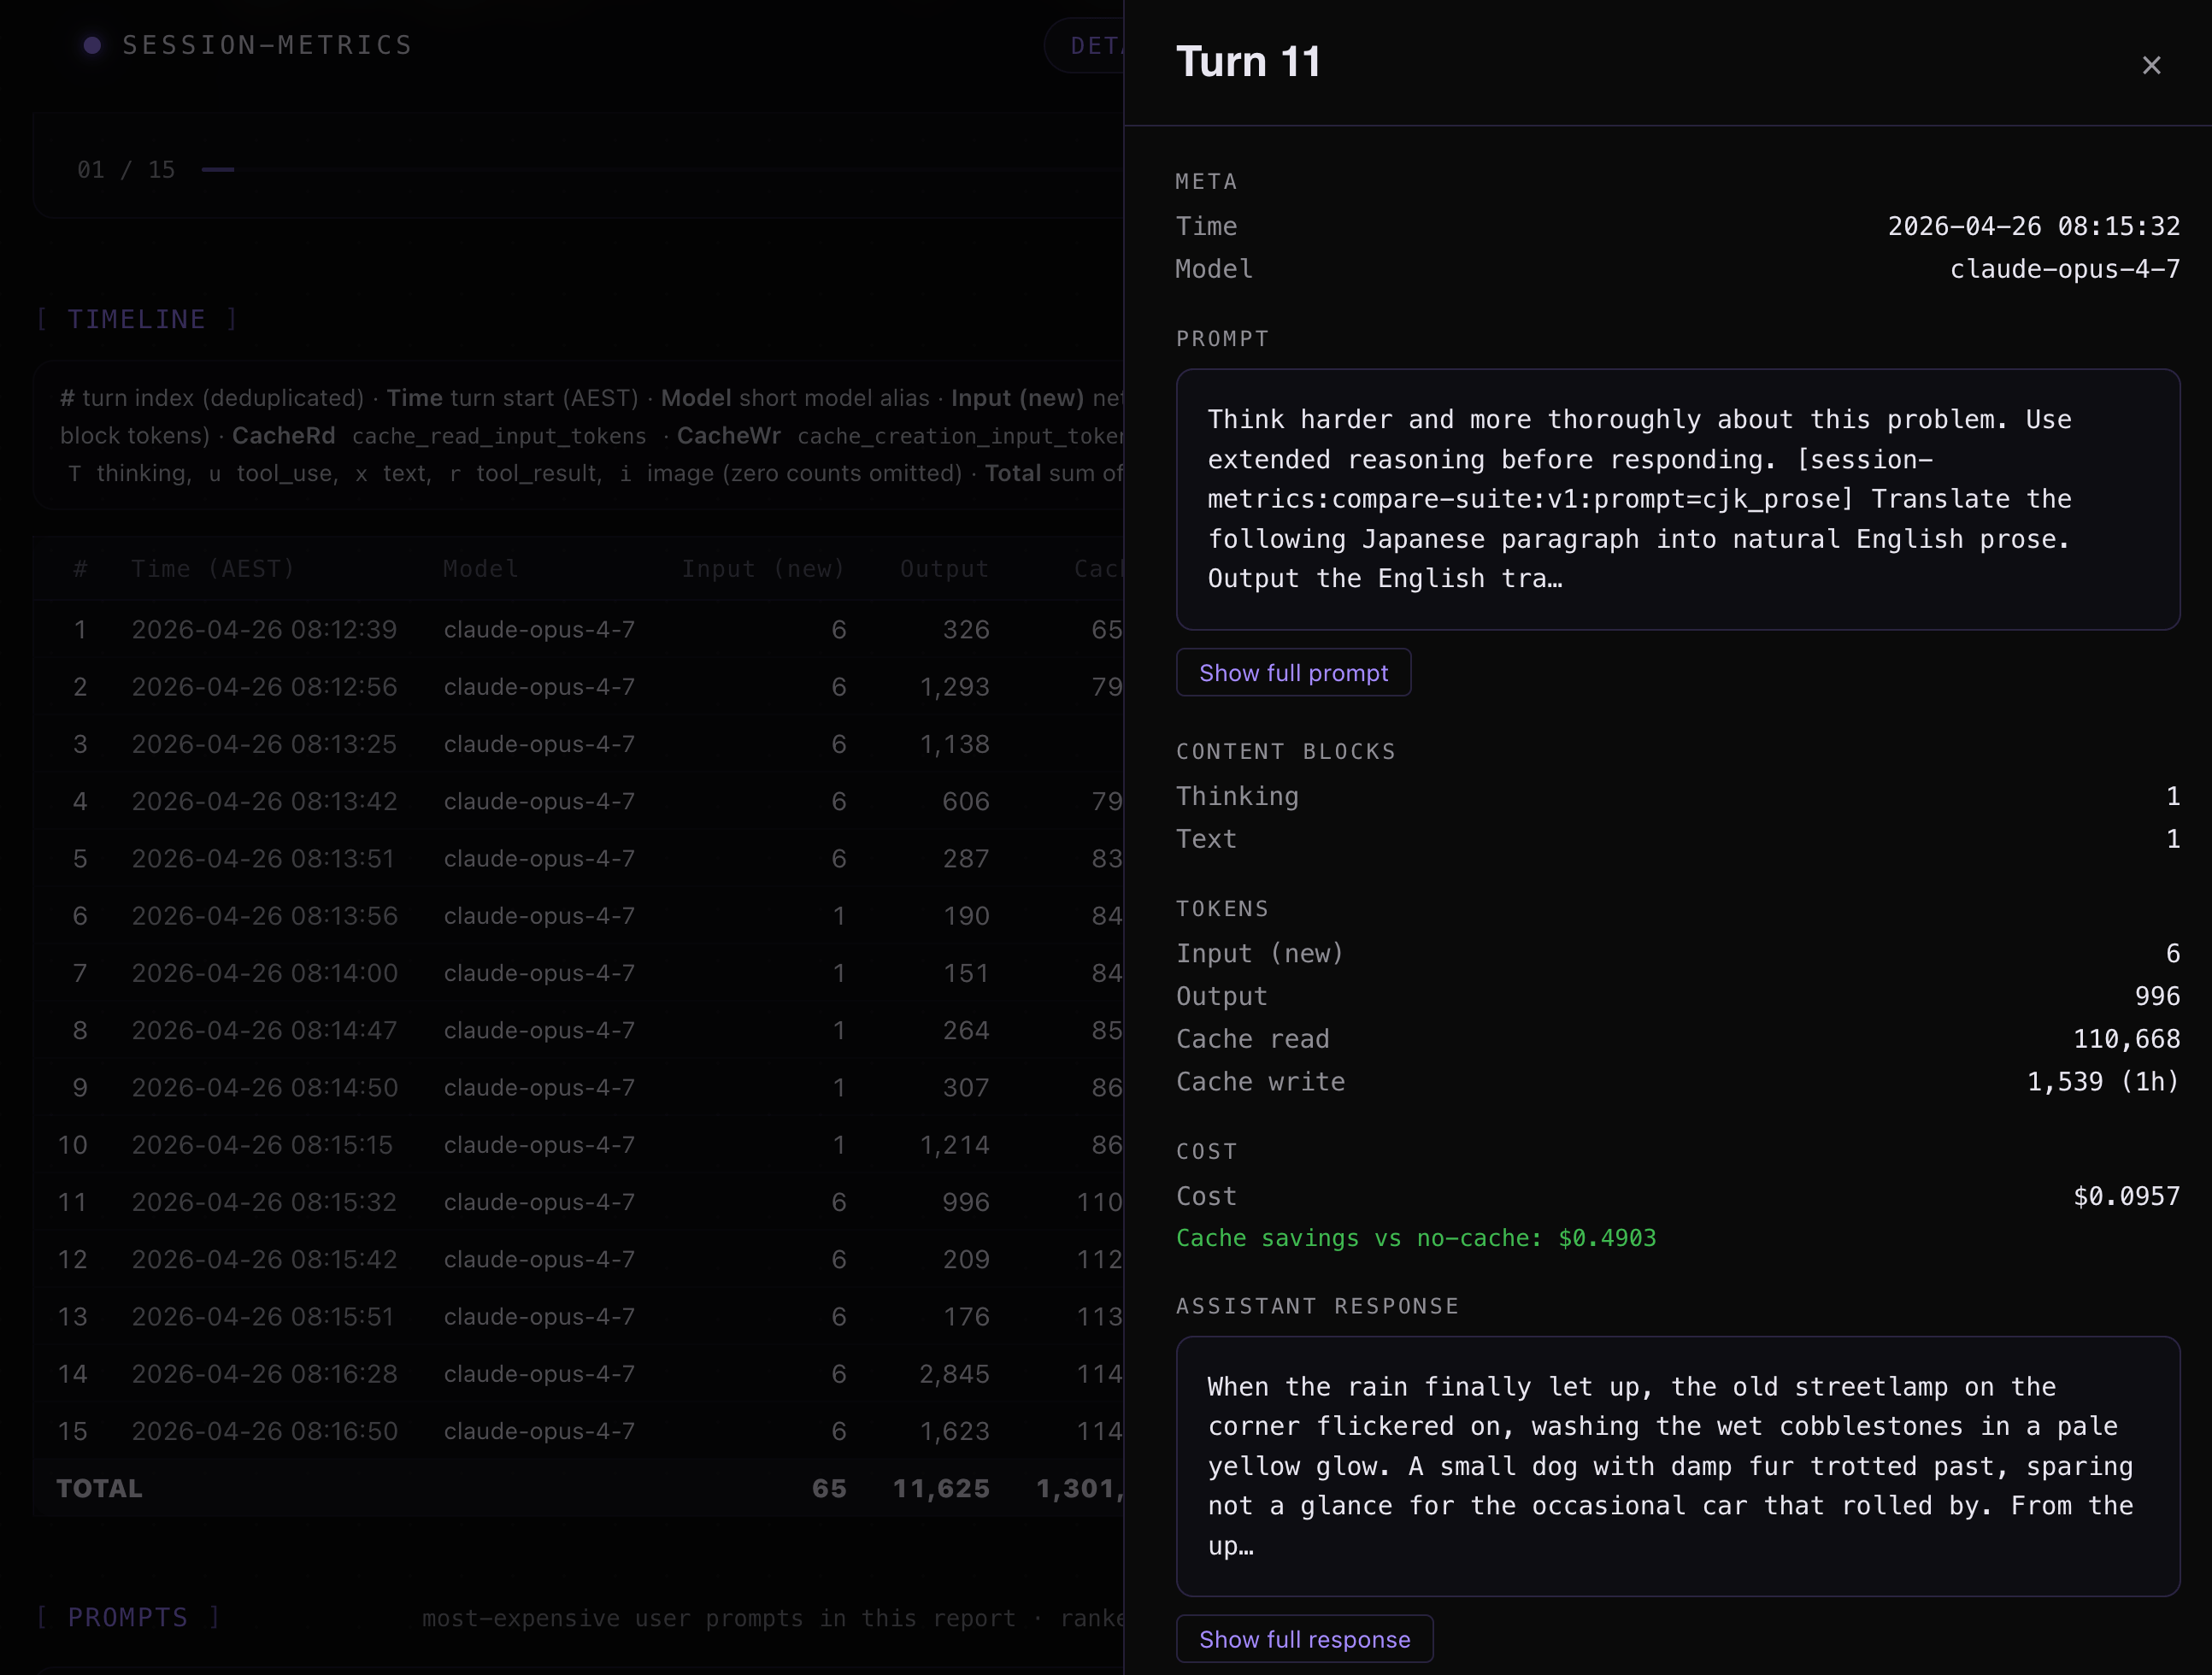
Example of actual turn by turn token usage and costs for Claude Opus 4.6 high with ultrathink vs Opus 4.7 xhigh with ultrathink using my session-metrics skill plugin HTML exported metrics for the headless Claude Code sessions.
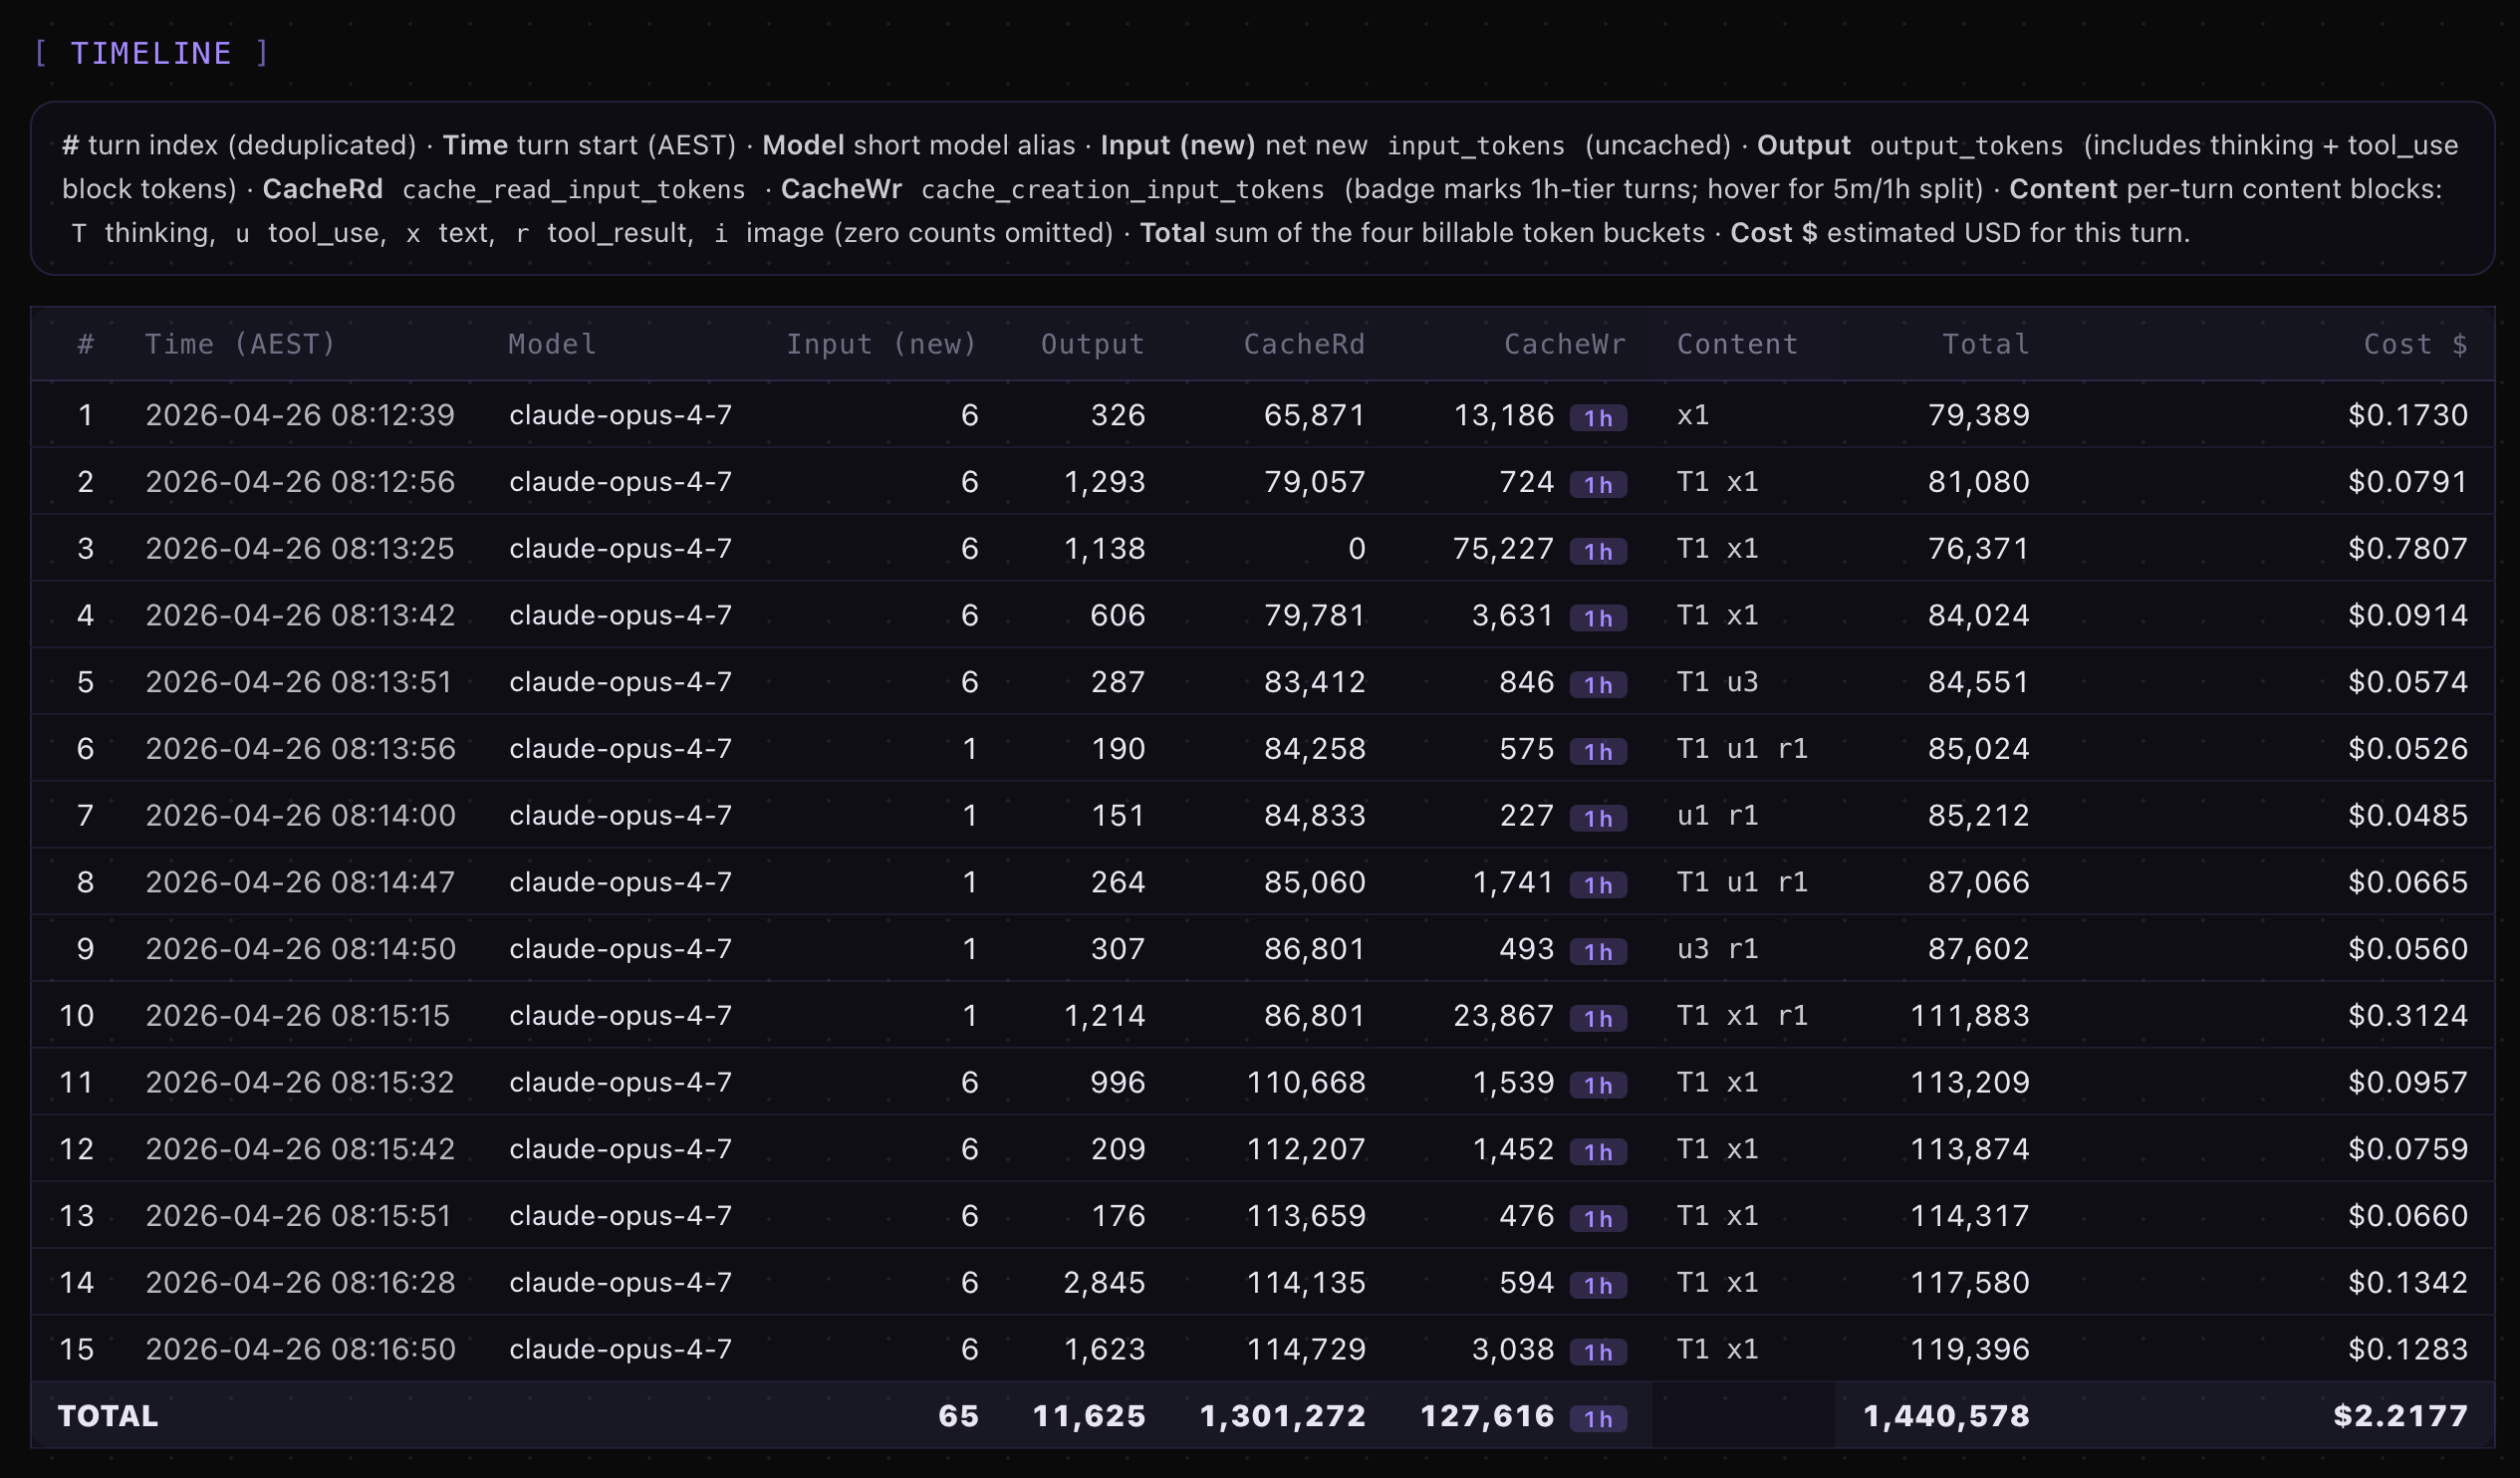
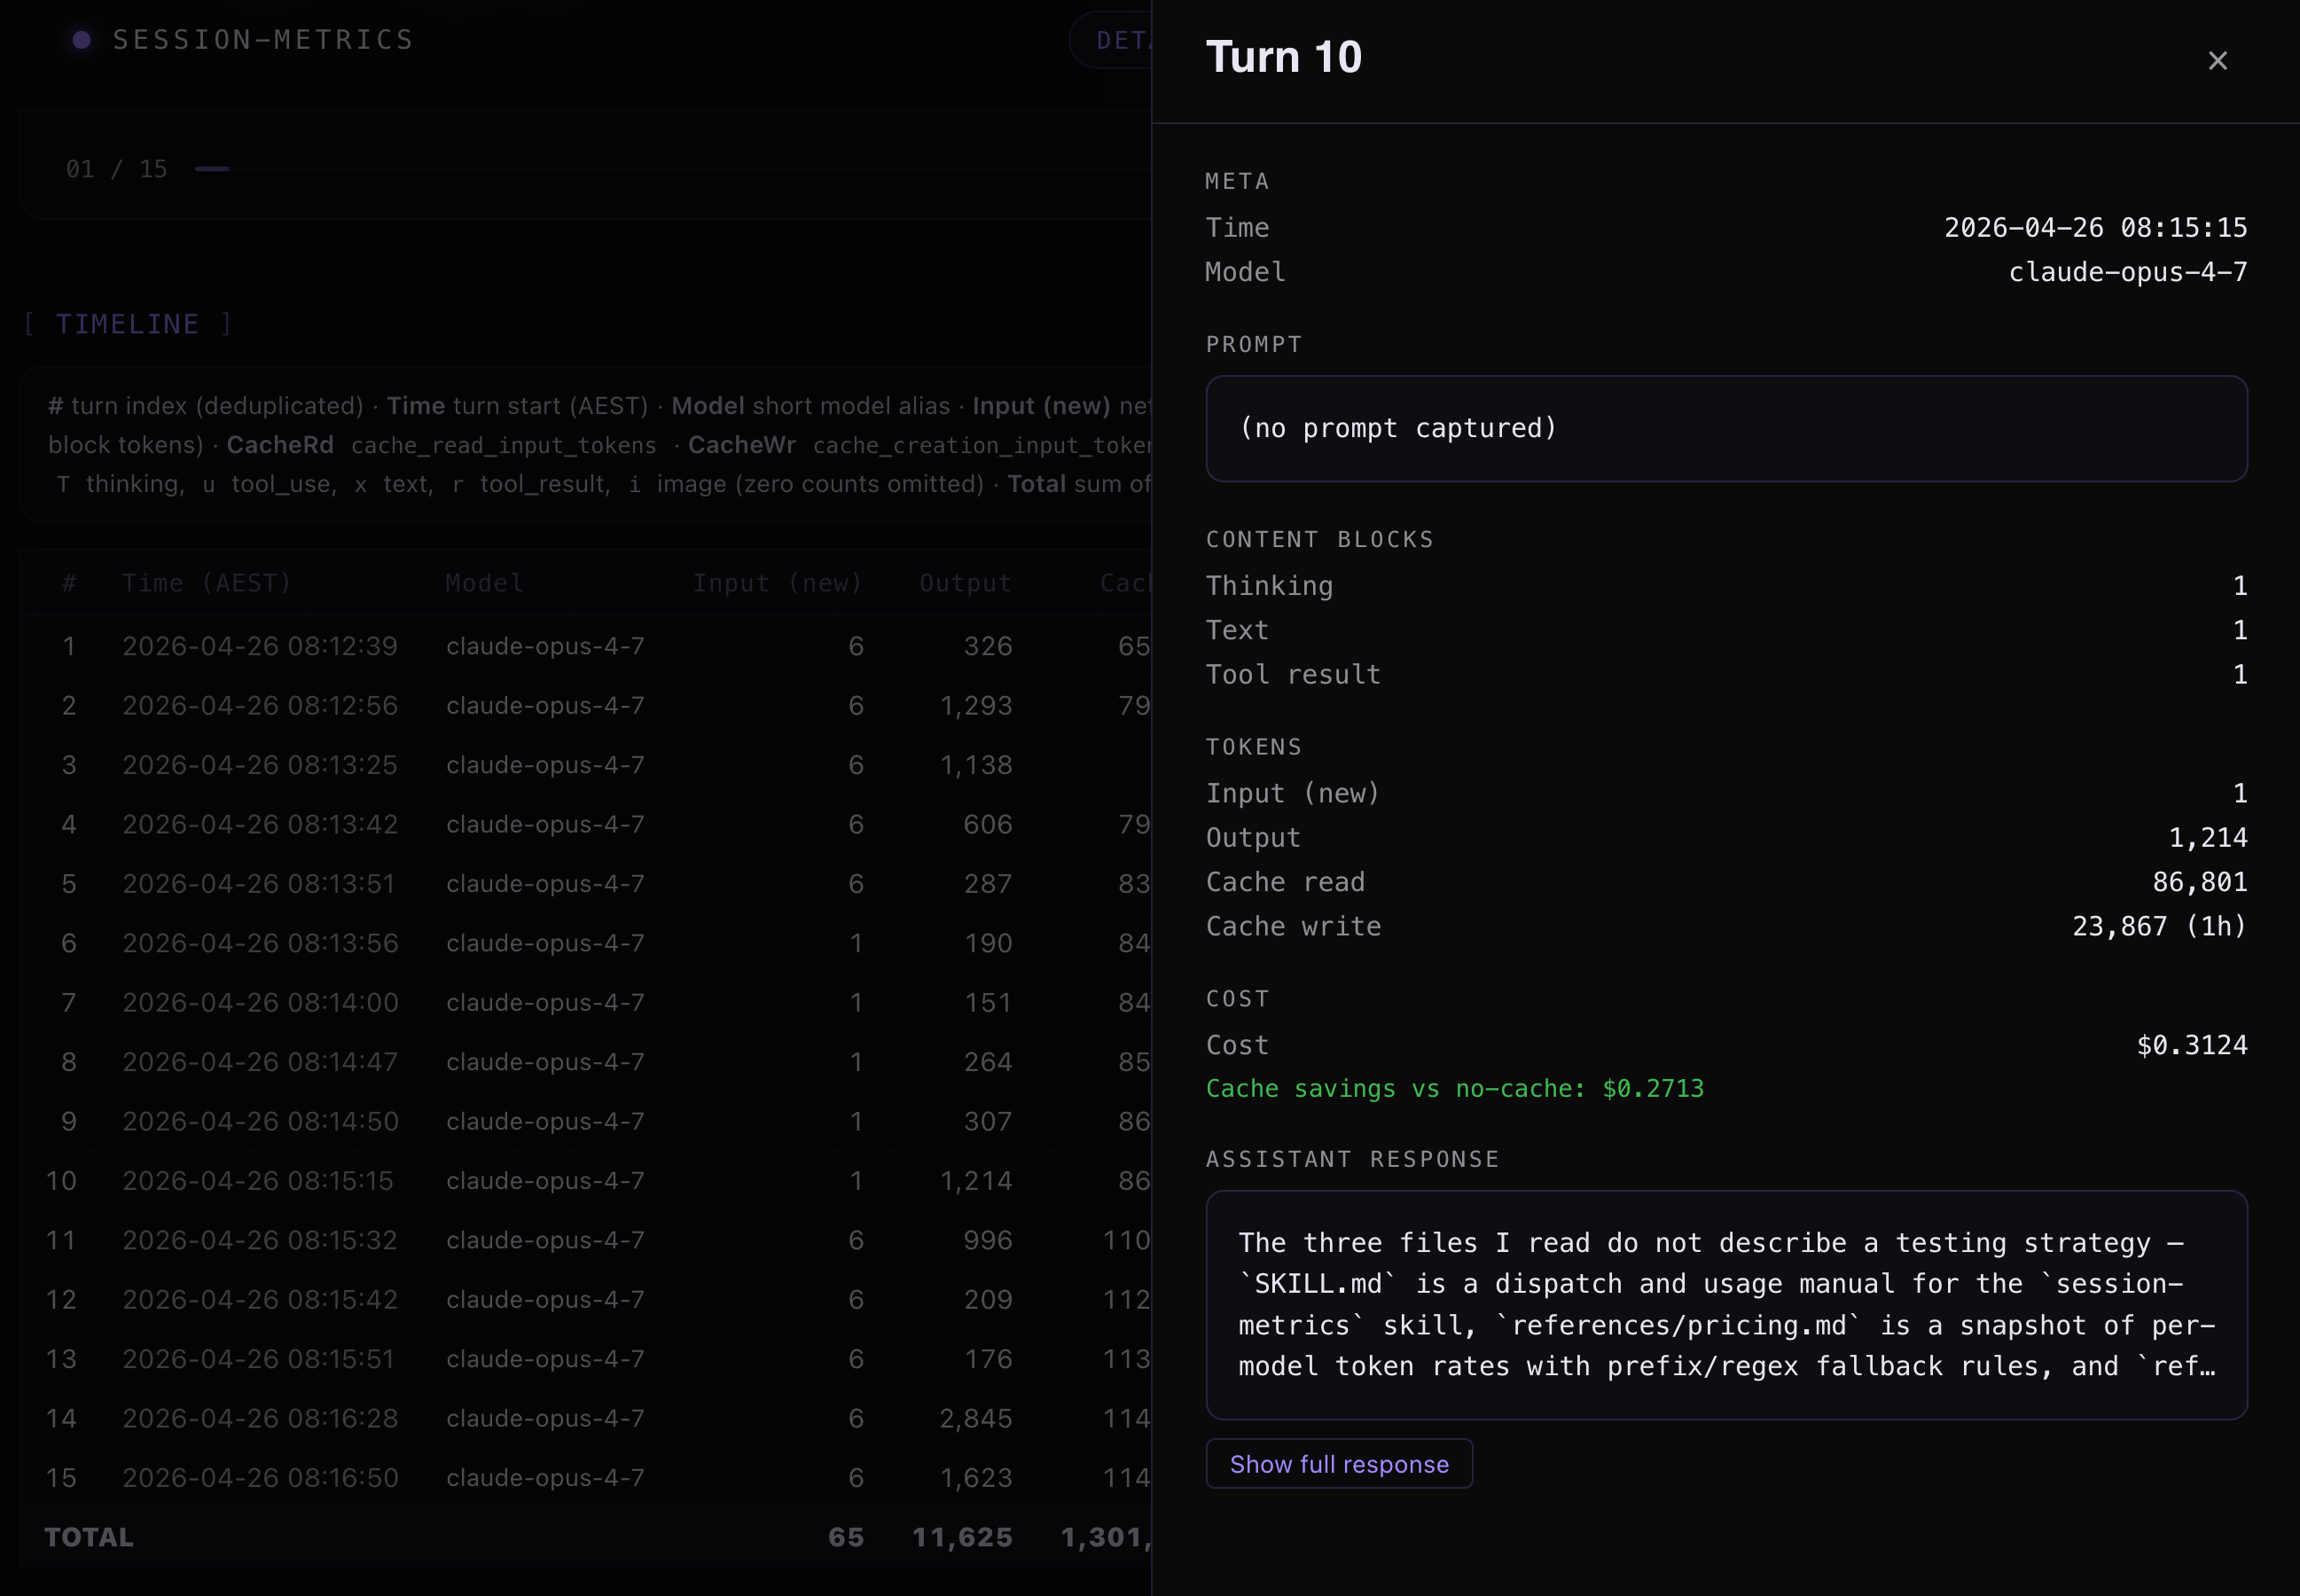
Looking at Opus 4.7 xhigh and turn 10 spike in pricing, looks like it went inspecting other skill files.
Opus 4.7 xhigh + ultrathink turn 11 inspection.
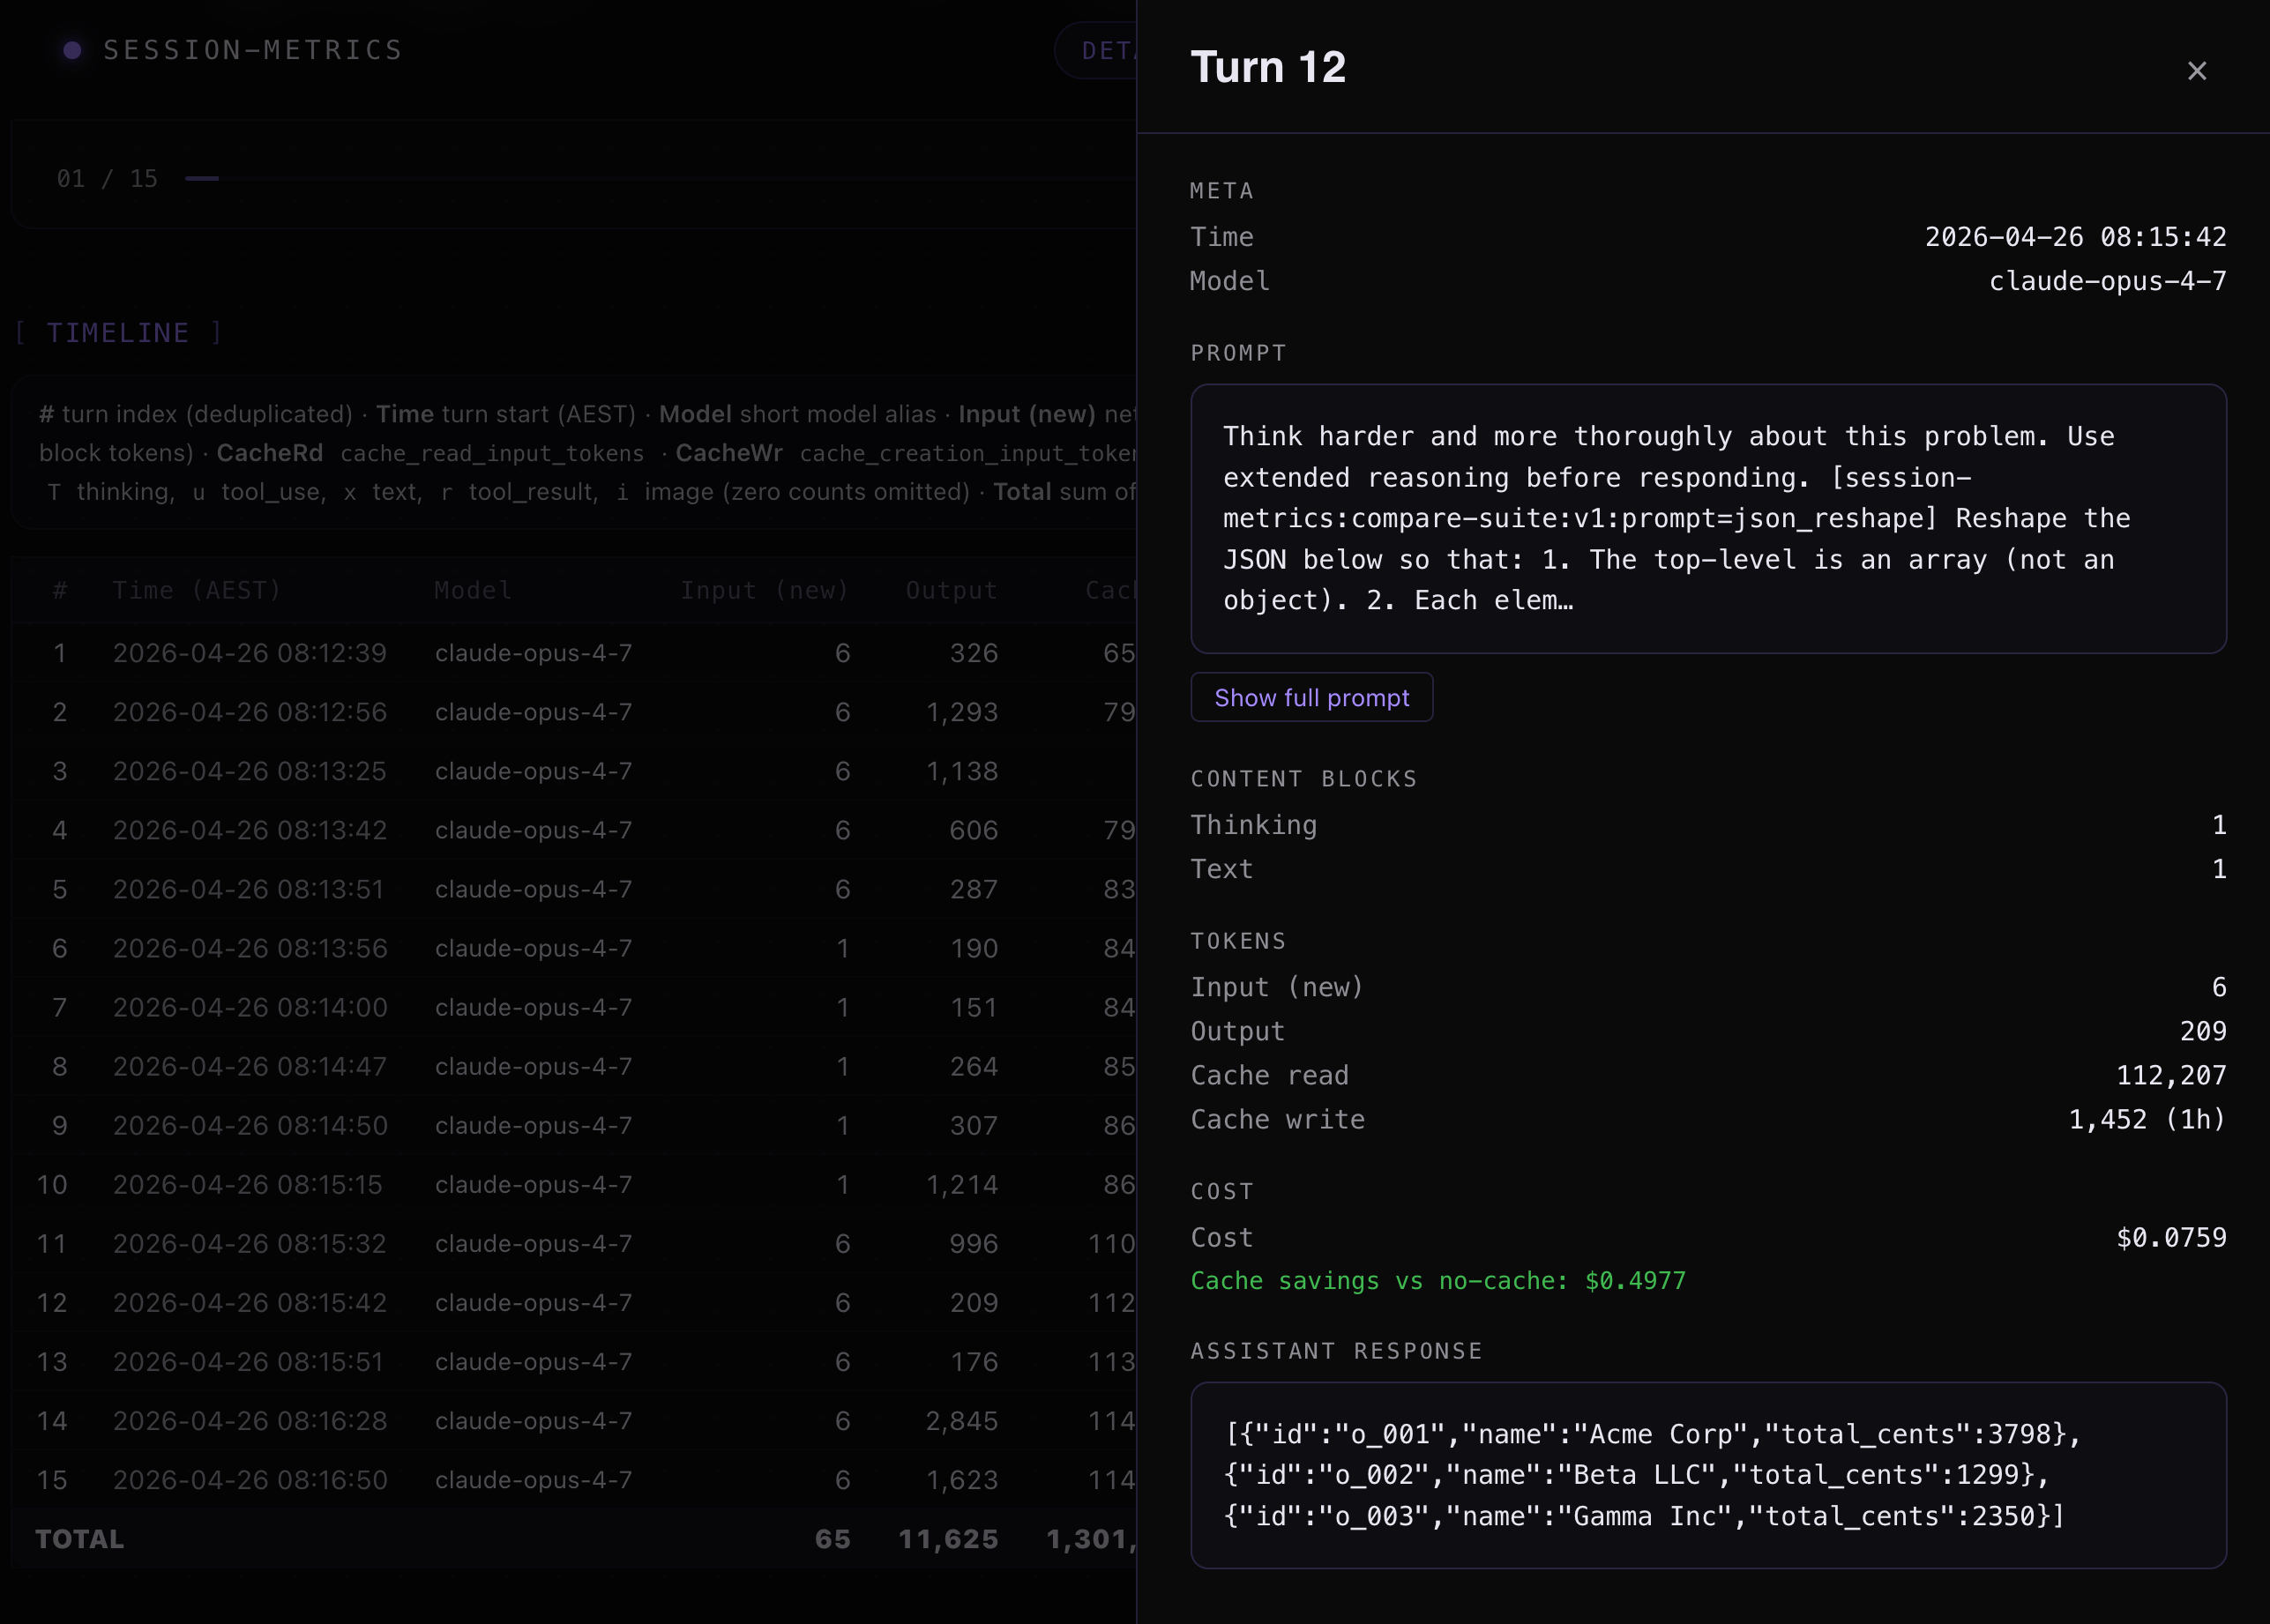
Opus 4.7 xhigh + ultrathink turn 12 inspection.
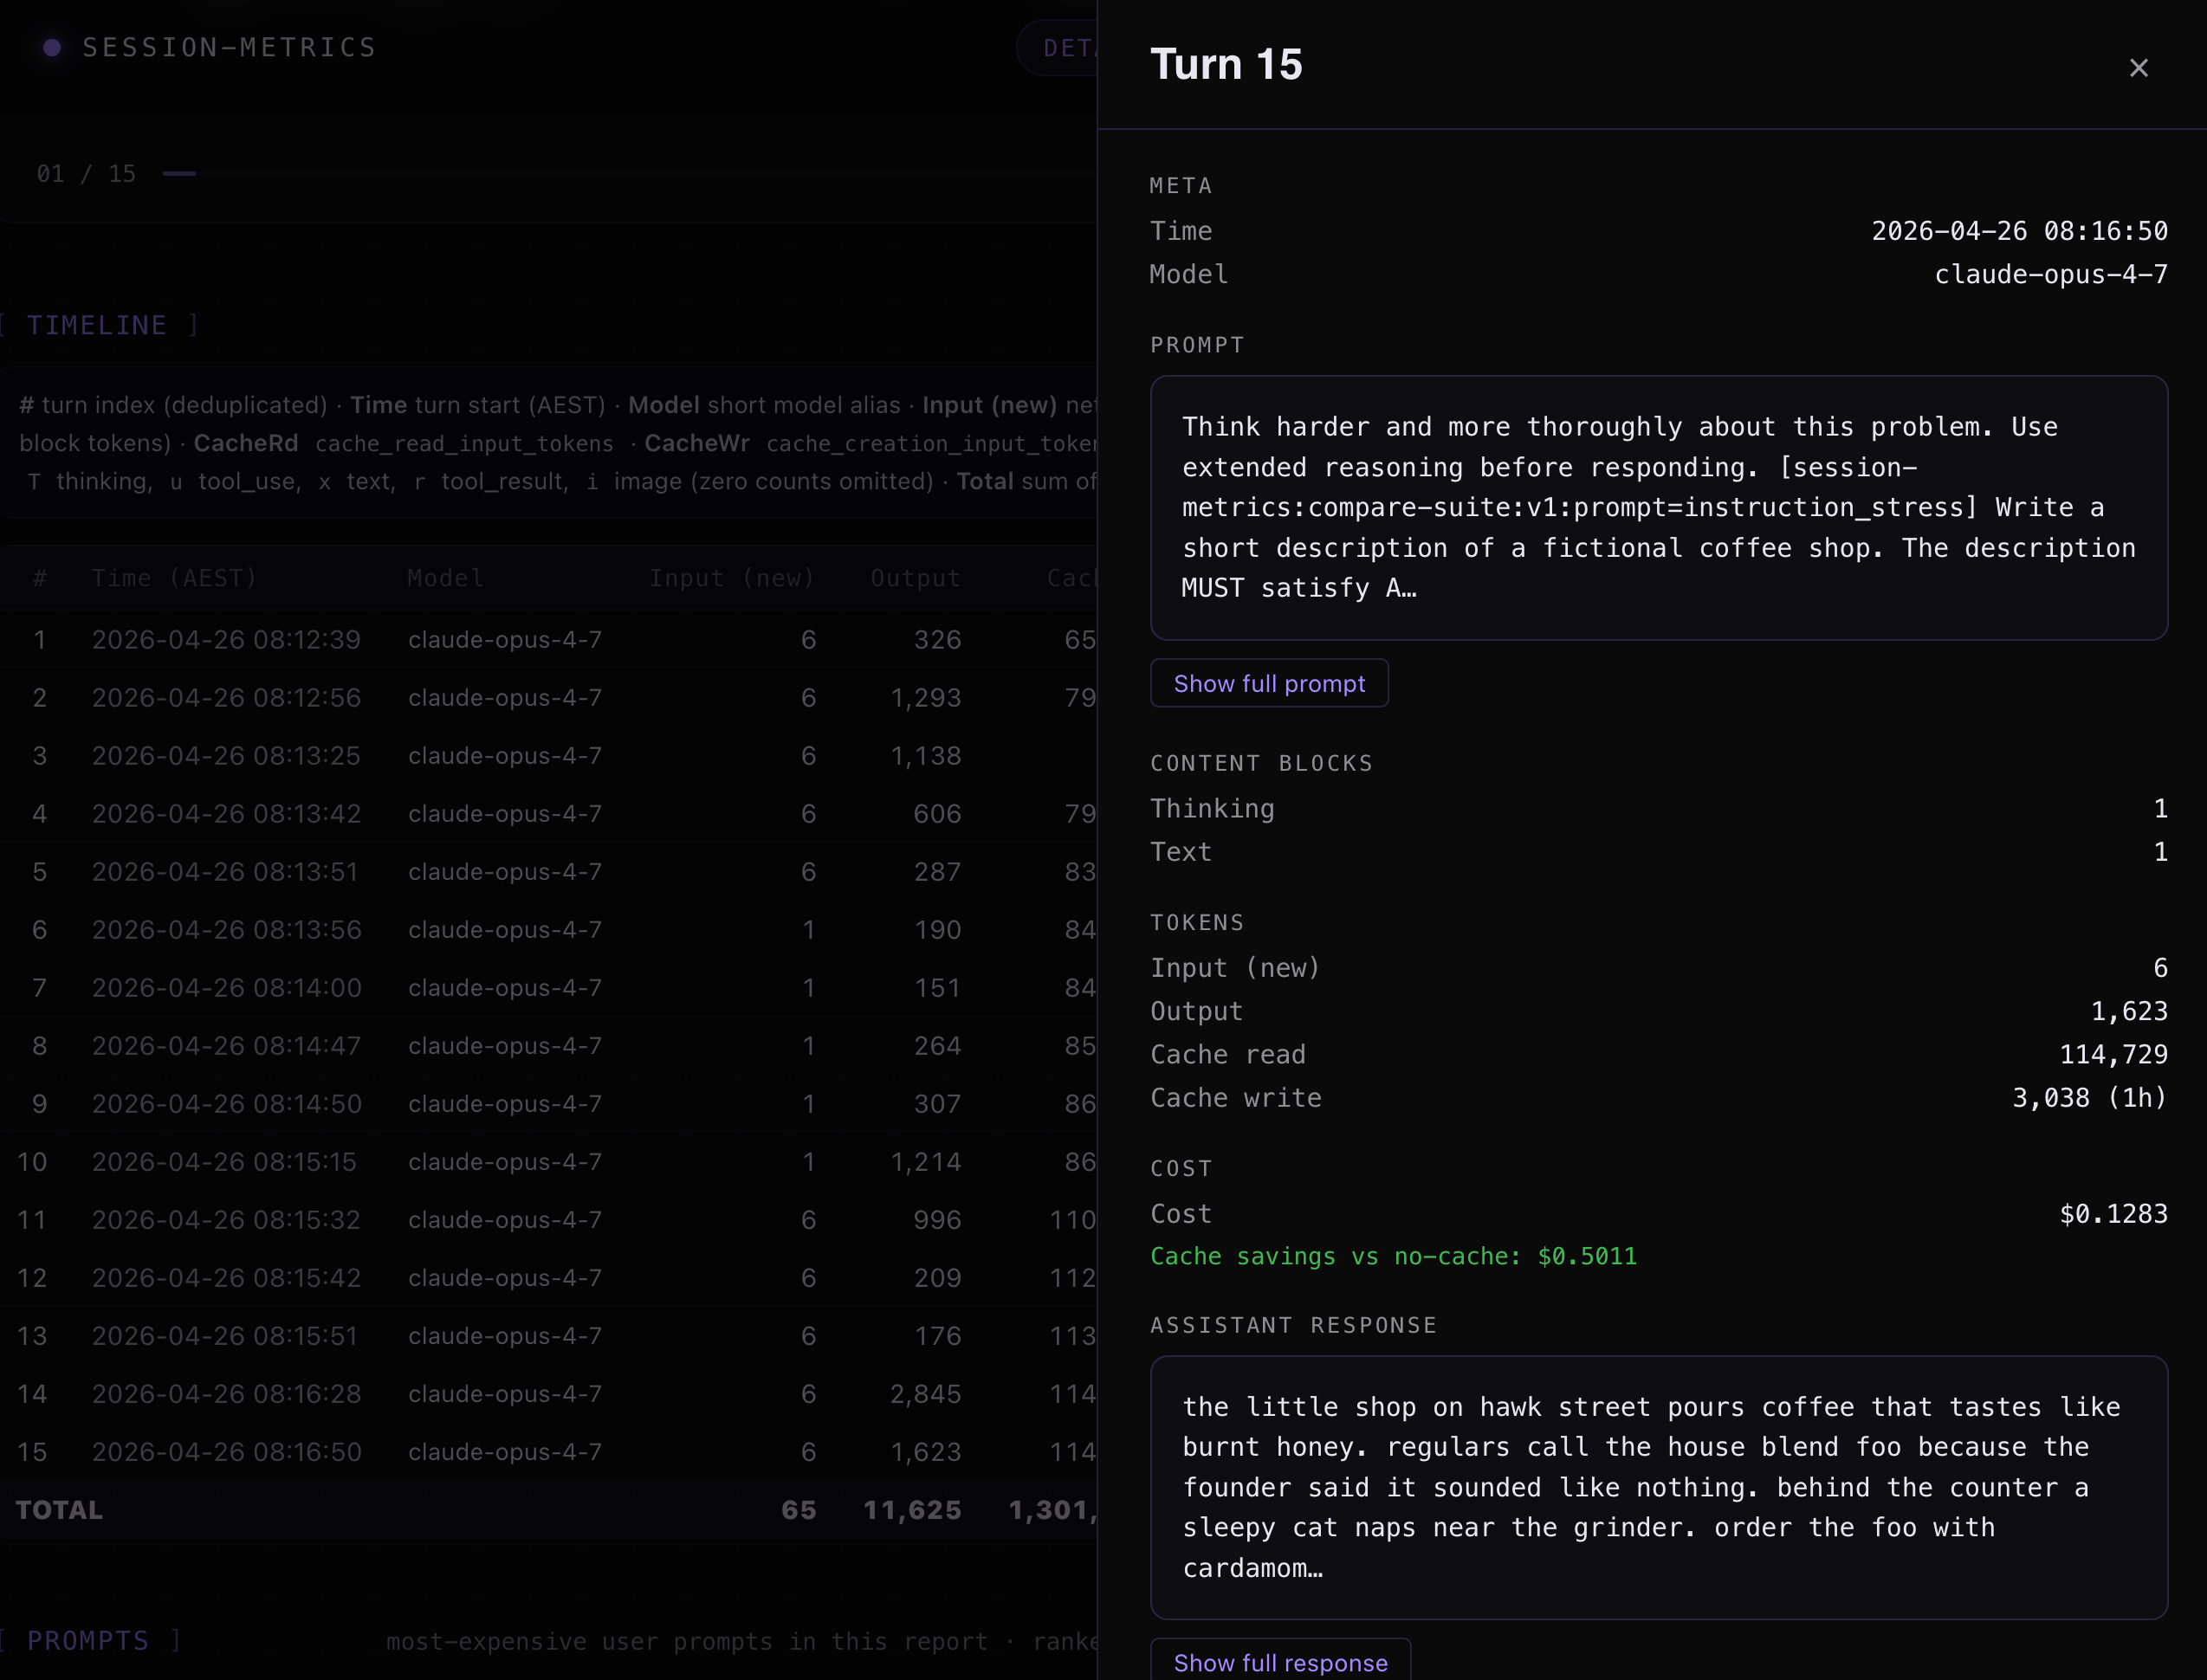
And instruction following prompt inspection with Opus 4.7 xhigh + ultrathink turn 15.
The inversion is the most important thing in this matrix: think-step-by-step and ultrathink made Opus 4.6 high cheaper but pushed Opus 4.7 xhigh above $2.20. The same wrapper moved two models in opposite directions.
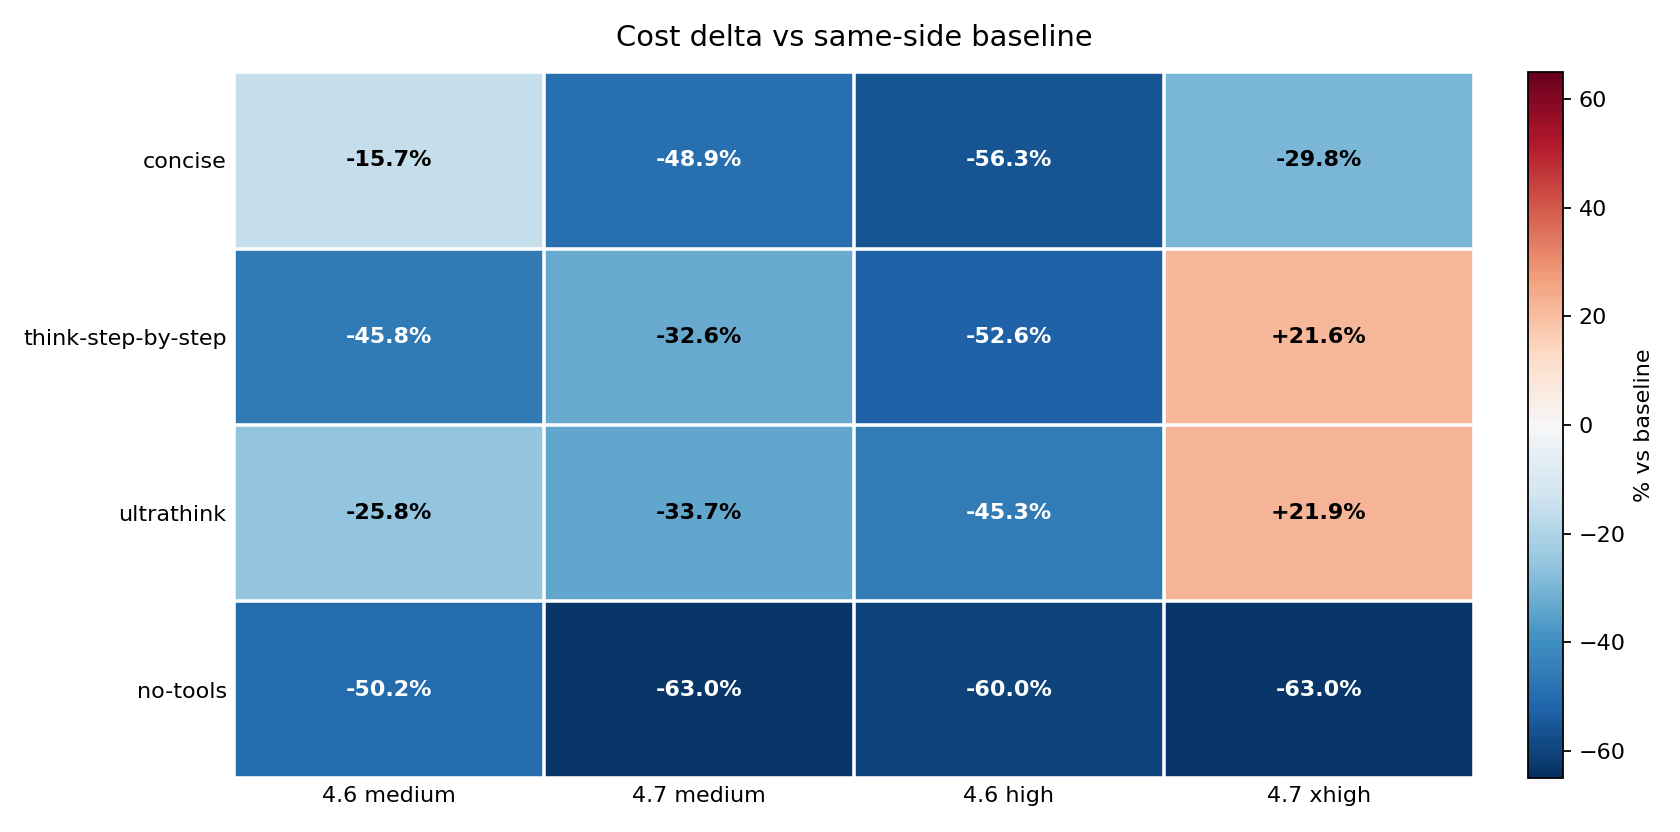
This chart compares each result against its own model’s baseline, which makes the savings and penalties easier to compare. no-tools reduced cost in every cell: -50.2%, -63.0%, -60.0%, and -63.0%. think-step-by-step and ultrathink were savings on Opus 4.6 high but cost increases on Opus 4.7 xhigh – and critically, neither wrapper improved IFEval on Opus 4.7. The model paid more and scored the same 8/9. That model-specific split is the main finding.
There is a framing that makes this inversion concrete. Looking at it through the cross-model lens: at baseline, Opus 4.7 costs 1.07x what Opus 4.6 costs on the same prompts – essentially the same price. Add think-step-by-step, and Opus 4.7 suddenly costs 2.74x more than Opus 4.6. Add ultrathink, and it is 2.38x more. Apply no-tools, and they are back to 0.99x – Opus 4.7 actually fractionally cheaper. The wrapper you choose does not just change how much you pay. It changes which model is more expensive.

no-tools: the performance tradeoff
The cost savings are real. So is the downside.
The regressions at high/xhigh fell on stack_trace_debug and typescript_refactor – tasks where reading repository files is part of a complete answer. tool_heavy_task explicitly required three file reads; under no-tools, the model answered from memory and produced less grounded output. Tool suppression removes the overhead and removes the capability at the same time.
The practical rule: use no-tools for self-contained tasks – prose drafting, code generation from an inline spec, data reshaping from inline content. Do not use it for tasks that require reading files, inspecting a codebase, or calling an external API.
concise: the strongest option when tools are required
When suppressing tools is not an option, concise is the next best lever – and it is closer to no-tools performance than the cost matrix suggests at first glance.
On Opus 4.6 high, concise cut cost from $1.70 to $0.74, a 56.3 percent reduction, nearly matching no-tools’ 60 percent – with IFEval holding at 9/9. No regression. It also cut wall-clock time from 180s to 146s – the largest latency reduction of any variant at that model/effort combination. On Opus 4.7 xhigh, it dropped cost from $1.82 to $1.28, down 29.8 percent, with IFEval holding at 8/9 (same as baseline).
At medium effort, concise cut Opus 4.7 cost by 48.9 percent – substantially more than at xhigh. For teams running Opus 4.7 at medium effort, concise may deliver more savings than the high/xhigh numbers suggest.
One counterintuitive result: concise increased tool calls at medium effort. Opus 4.6 medium went from 3 tool blocks at baseline to 7 under concise. Telling the model to be brief apparently shifted it toward delegating lookup work to tools rather than reasoning through it. The instruction changed answer style without reducing agentic activity – and raised latency by 11.8 percent on 4.6 medium even as it cut latency on 4.7 medium by 9.0 percent.
For Opus 4.6 workflows that need tool access, concise is the first wrapper to test. For Opus 4.7, it produces a meaningful cost reduction but does not get close to no-tools.
IFEval: accuracy and instruction-following across all variants
IFEval tests whether a model follows specific, verifiable instructions in its response – things like “respond in under 50 words,” “include a code block,” or “use exactly three bullet points.” It gives a binary pass/fail per prompt, not a fluency score. That makes it a clean signal for whether a steering wrapper changed model behavior in unintended ways. The suite has 9 testable prompts per session; tool_heavy_task is excluded from scoring because it has no verifiable pass/fail criteria (its output depends entirely on tool access being available).
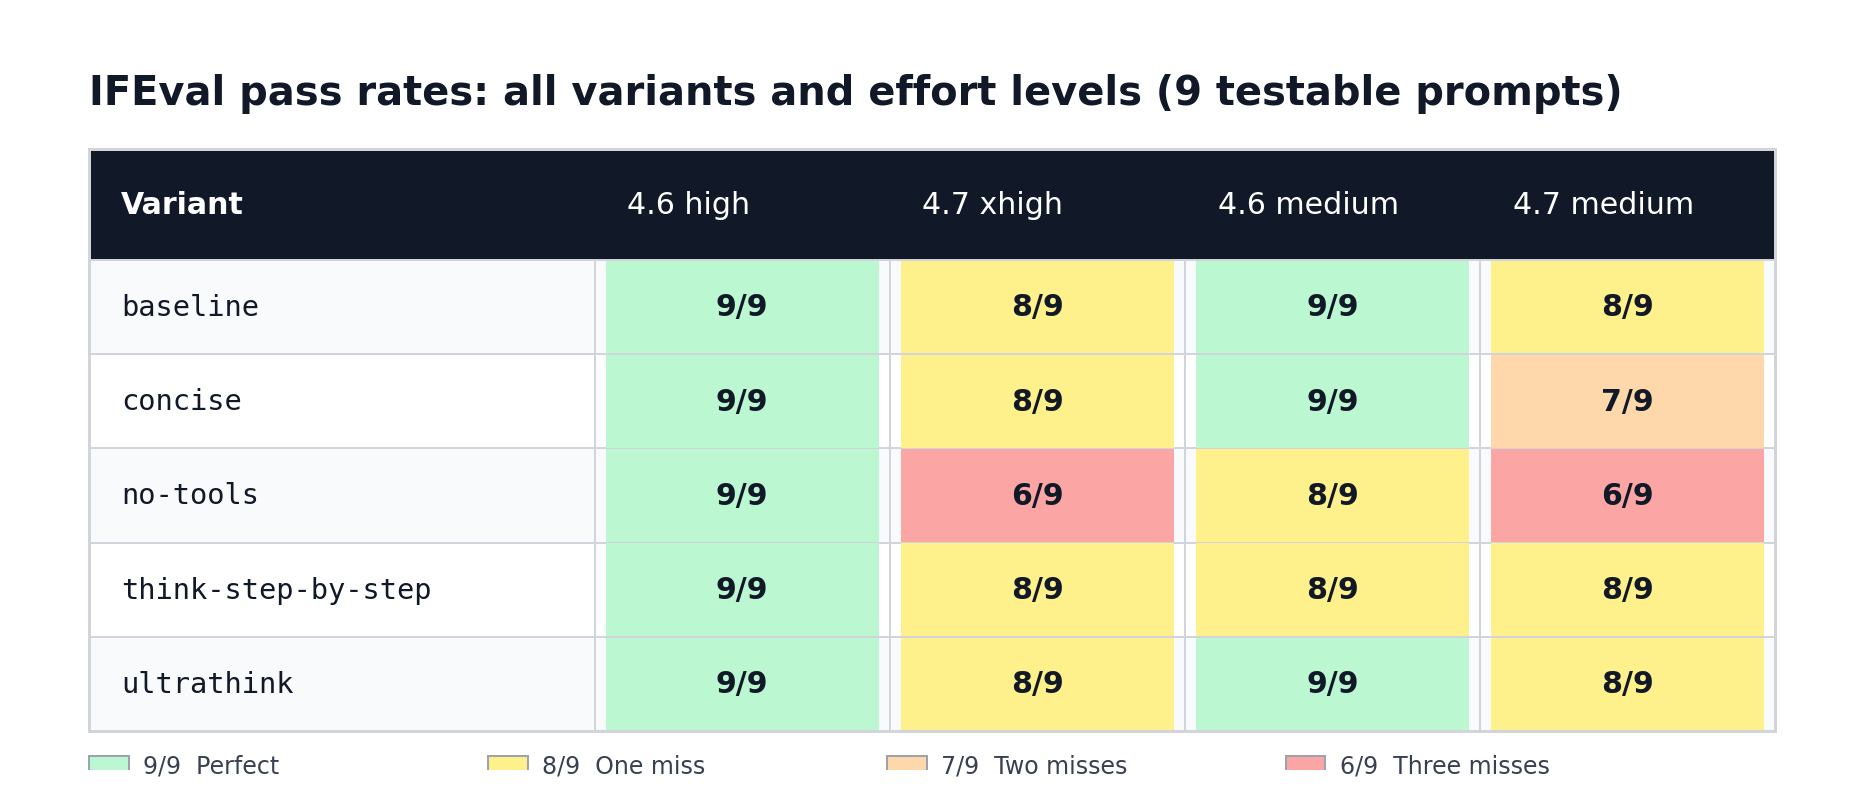
The pass-rate matrix – all variants, both effort levels:
At high/xhigh effort (Opus 4.6 high vs. Opus 4.7 xhigh), Opus 4.6 scored 9/9 (100%) in every single variant – baseline, concise, no-tools, think-step-by-step, and ultrathink. Not a single failure across all five high-effort runs. Opus 4.7 xhigh varied: 8/9 (89%) under baseline, concise, think-step-by-step, and ultrathink; 6/9 (67%) under no-tools.
At medium effort (Opus 4.6 medium vs. Opus 4.7 medium), Opus 4.6 scored 9/9 in three variants (baseline, concise, ultrathink) and 8/9 in two (no-tools and think-step-by-step). Opus 4.7 medium scored 8/9 under baseline, think-step-by-step, and ultrathink; 7/9 (78%) under concise; and 6/9 (67%) under no-tools.
Summarised as a grid (testable prompts only, out of 9):
Which prompts actually failed – and when:
claudemd_summarise failed for Opus 4.7 in 8 out of 10 runs. The two exceptions were xhigh concise and xhigh ultrathink – both xhigh-effort runs where the model’s more aggressive tool use meant it actually read the project file before summarising it, satisfying the IFEval constraint. The raw session data shows why it failed everywhere else: Opus 4.7 wrote 121-125 words when asked for exactly 120. Opus 4.6 at high effort spent 3,279 output tokens on this prompt – mostly extended thinking – and landed on exactly 120. Opus 4.7 used 303 tokens and wrote 125. The thinking budget, not just the instruction, made the difference. Opus 4.6 failed this prompt in only two cases: medium no-tools and medium think-step-by-step, both at reduced effort. The opener is not a neutral warm-up for Opus 4.7. If your real workflow starts with a context-load or file-read task, budget for this failure in your performance baseline.
typescript_refactor failed for Opus 4.7 in four runs: xhigh no-tools, medium no-tools, xhigh concise, and medium concise. In the no-tools runs, the raw output shows the model used the word “refactor” only once in its explanation – the IFEval constraint required exactly twice. The code was correct; the explanation text came up one short. Under concise, the same constraint tripped the same way: the steered model wrote a tighter explanation and dropped the second use of the word. Opus 4.6 passed this prompt in every run.
stack_trace_debug failed for Opus 4.7 in three runs: xhigh no-tools, medium no-tools, and xhigh ultrathink. The constraint was 200 output tokens or fewer. Under xhigh no-tools, the model wrote 312 tokens – 56 percent over the limit. Under xhigh ultrathink it wrote 606 tokens – three times the limit. Pushing the model to “think harder” made the brevity constraint worse, not better. Opus 4.6 stayed under the limit with shorter, more direct answers. Without tool access, the model compensates by explaining more in text.
english_prose, code_review, cjk_prose, json_reshape, csv_transform, and instruction_stress passed for both models in every single run. None of these prompts failed under any variant or effort level. All six are self-contained: they require no file reads, no codebase inspection, and no external API calls. Whatever steering wrapper you apply, these prompts are safe.
The three patterns worth keeping:
Opus 4.6 has a near-perfect instruction-following floor. It failed only twice across 50 prompted sessions (medium no-tools and medium think-step-by-step, both on claudemd_summarise), and only when the steering explicitly removed the tool access the prompt needed. Every other variant at every effort level: 9/9.
No-tools is the only variant that meaningfully degrades instruction-following. At high/xhigh it drops Opus 4.7 from 8/9 to 6/9. At medium it drops both models: 4.6 from 9/9 to 8/9, and 4.7 from 8/9 to 6/9. The other four variants produce at most one failure on 4.7 (and zero on 4.6 at high effort).
The only run where 4.6 and 4.7 tied on IFEval was think-step-by-step at medium (both 8/9, Δ=0pp). That tie happened because 4.6 degraded – not because 4.7 improved.
Output tokens did not explain cost
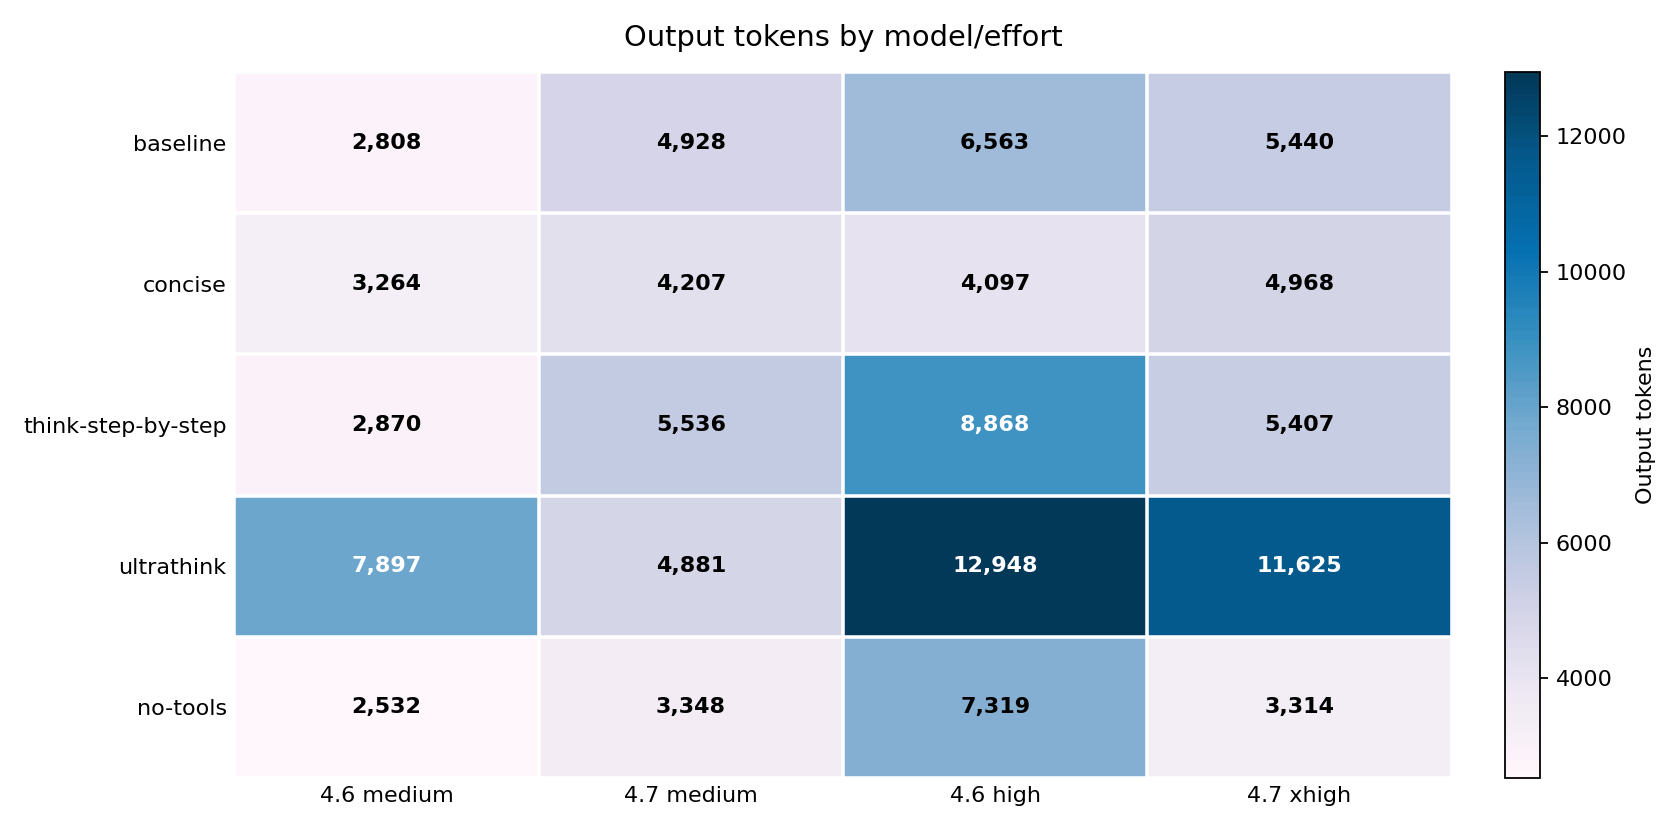
Cheaper runs did not always produce shorter answers. no-tools increased Opus 4.6 high output tokens from 6,563 to 7,319 while cutting total cost by 60 percent. That gap – more output, less cost – shows that the final answer length was not driving the bill.
ultrathink ran the opposite direction: output tokens nearly doubled on average across the benchmark (+97.8% vs baseline), and cost went up. The session was not just giving longer answers – it was accumulating far more context between turns.
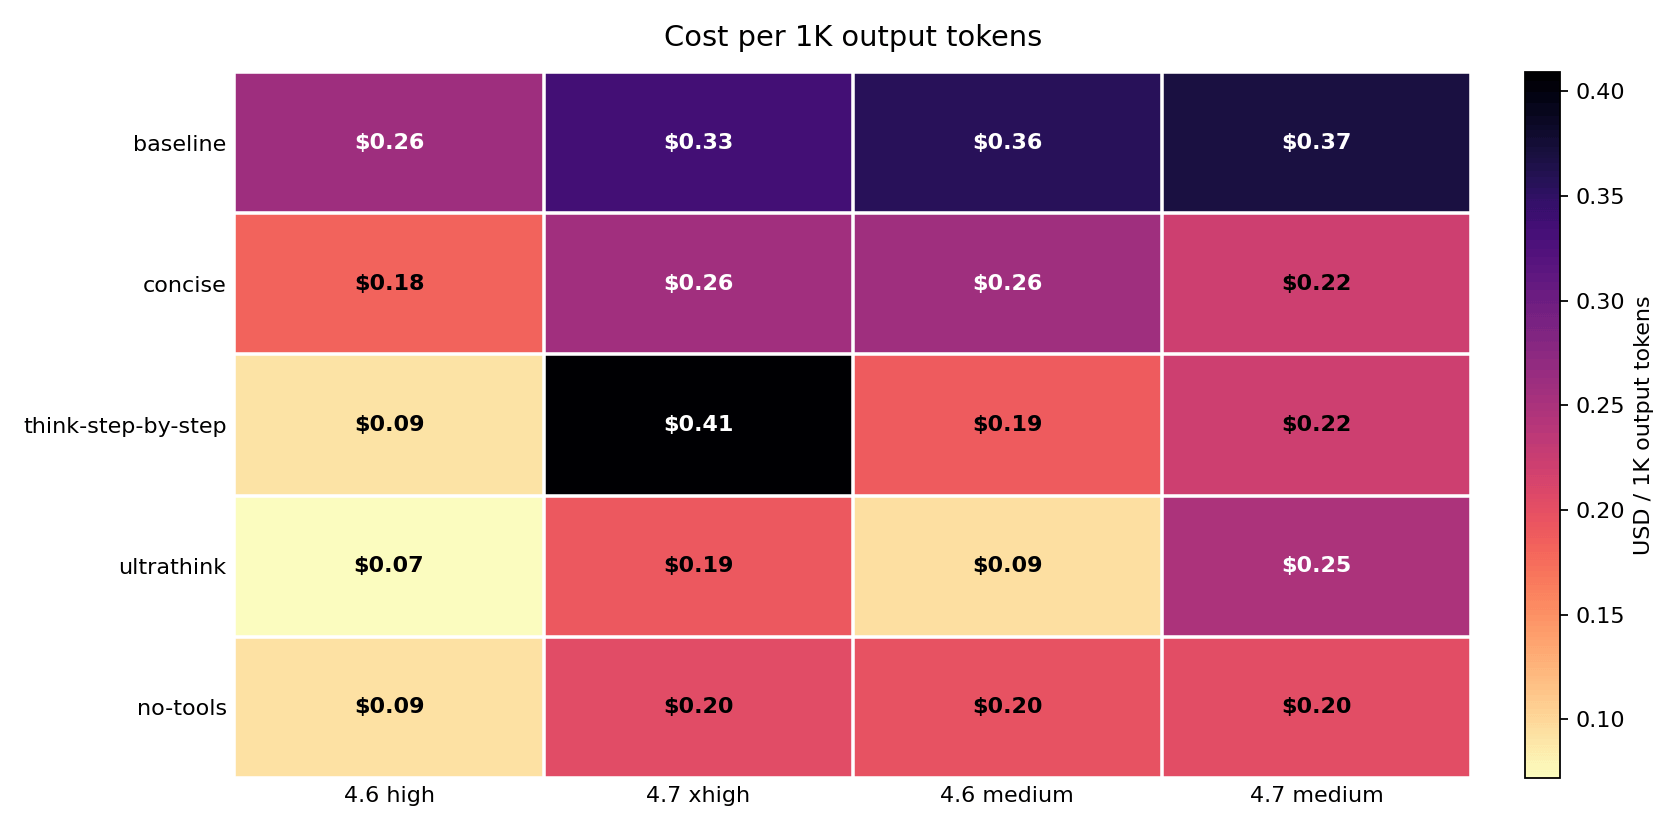
This chart normalizes cost against visible output: how much did each 1,000 answer tokens actually cost? High values signal overhead beyond the answer itself – tool loops, extra agent turns, cache writes, and reasoning billed through output tokens. no-tools collapsed that overhead on both Opus 4.7 columns. The answer got slightly longer but everything around it got much cheaper.
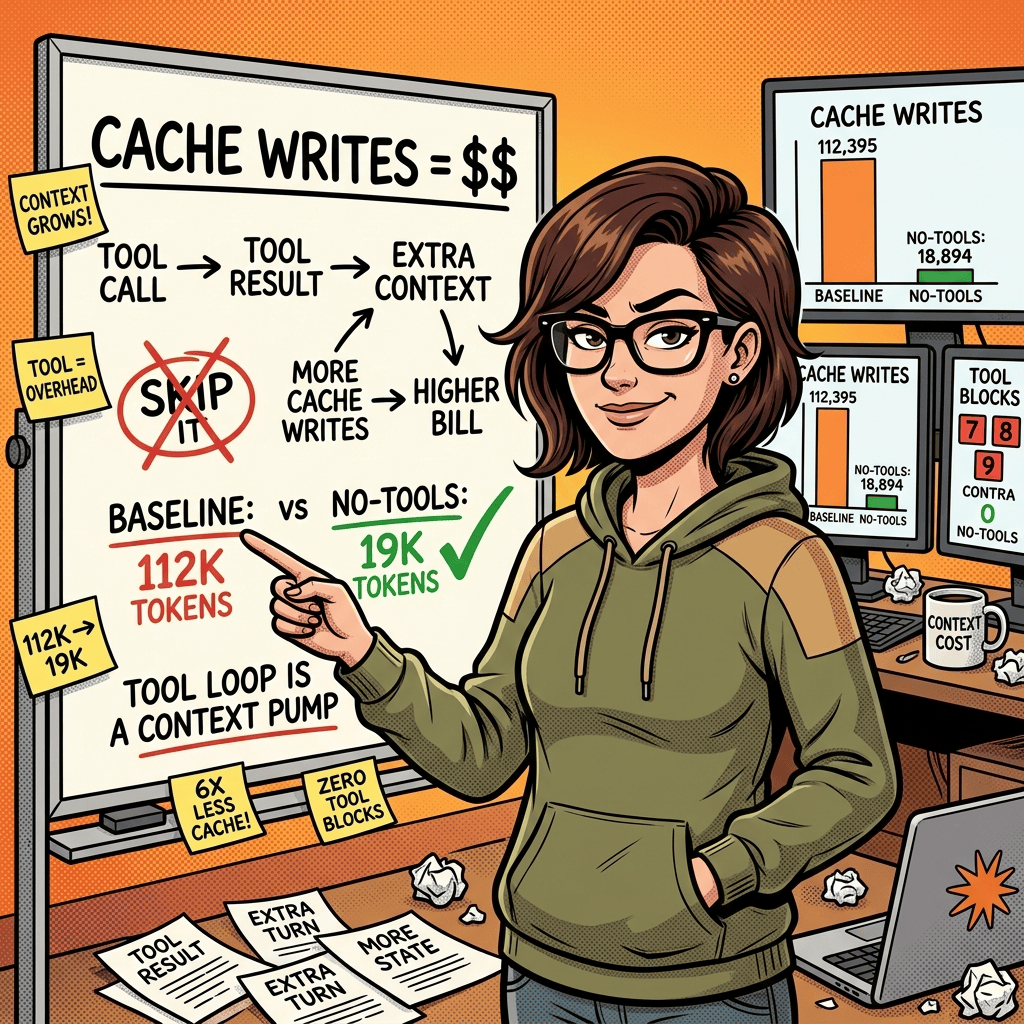
Cache writes and tool use explain the savings
Every time Claude Code reads a file, processes a tool result, or carries a long conversation forward, those tokens get written to a cache. Subsequent turns can then read that context cheaply instead of reprocessing it. The more context a session writes and re-carries, the more expensive it gets – because cache writes are billed at the write rate, and they compound across turns.
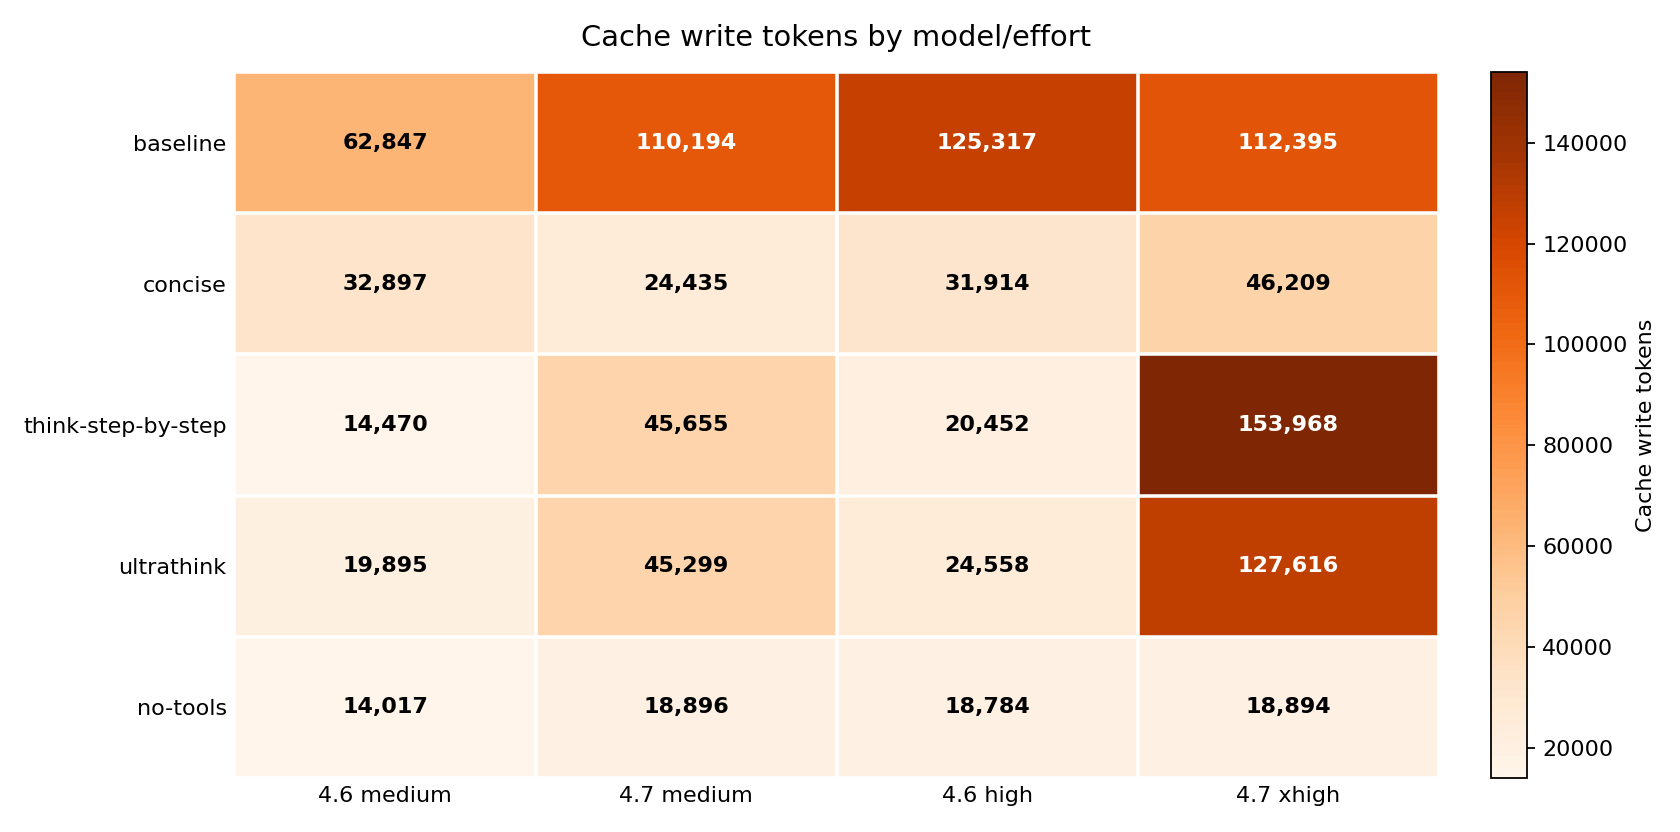
At Opus 4.7 xhigh, the baseline session wrote 112,395 cache tokens. think-step-by-step pushed that to 153,968 – a 7.53x cache write ratio versus Opus 4.6’s 20,452 in the same variant. ultrathink reached 127,616 (5.20x versus Opus 4.6’s 24,558). no-tools wrote only 18,894 – an 83 percent reduction, and nearly identical to Opus 4.6’s 18,784 in the same variant. At that level, the two models’ cache behavior is essentially converged.
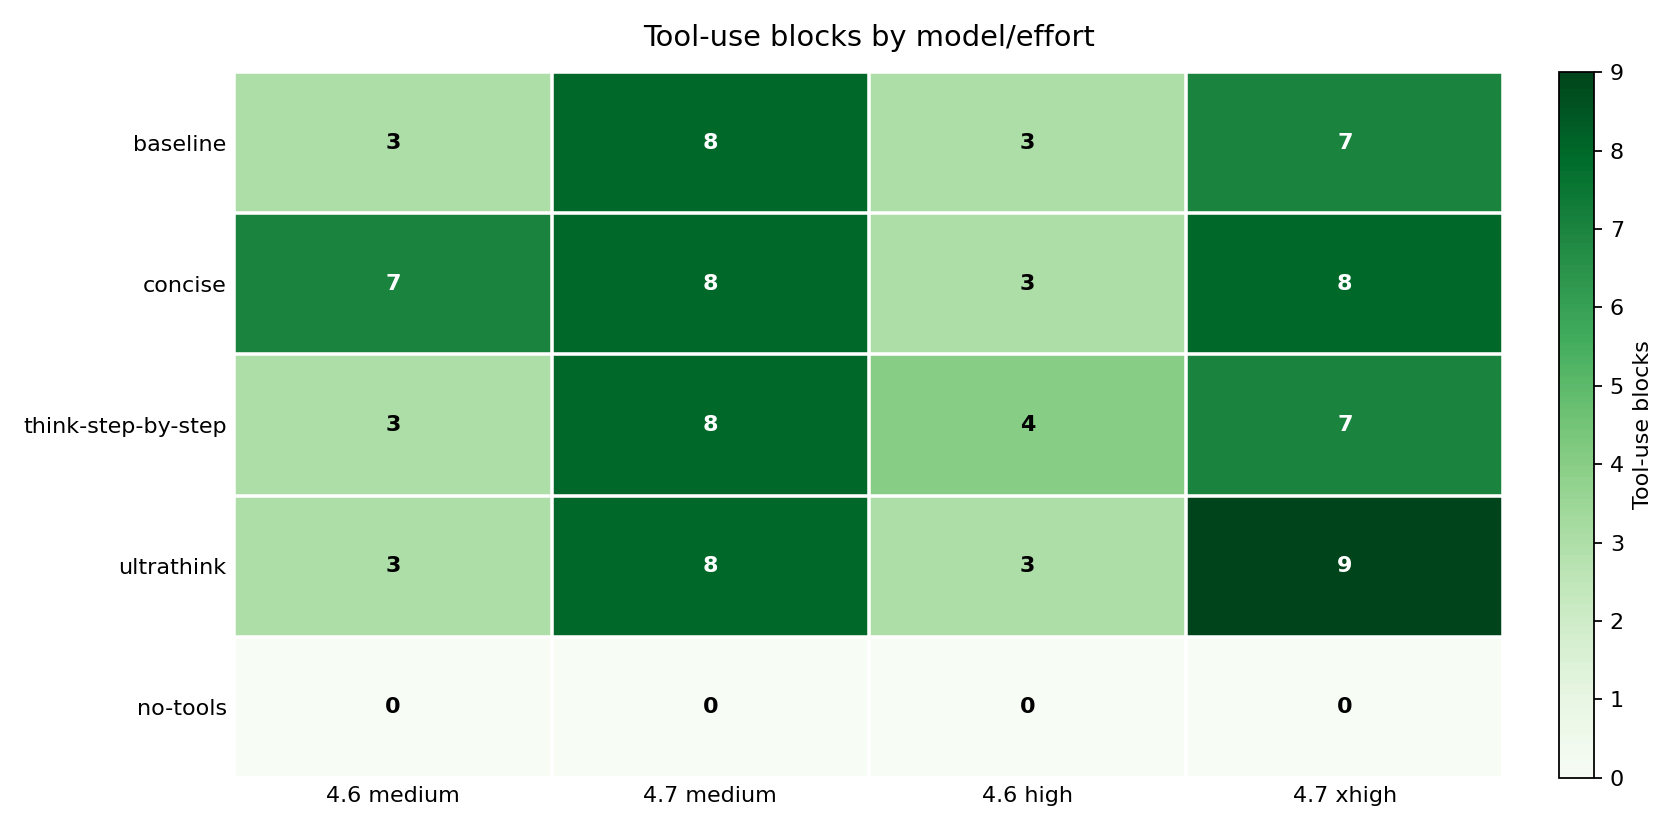
Every tool call creates a chain: the model calls a tool, the tool returns a result, and that result becomes context for the next turn. no-tools recorded zero tool-use blocks across all four model/effort cells. Baseline Opus 4.7 used 7 to 8 tool blocks per session. ultrathink pushed Opus 4.7 xhigh to 9. Each of those calls added context that kept accumulating.
Where the cache actually built up: turn by turn
The aggregate numbers above show totals. The turn-by-turn breakdown shows something more useful: which specific prompts caused the spikes.
Each session runs the 10 prompts in order, one prompt per turn. The model’s state carries forward between turns – so a large cache write on turn 5 means all subsequent turns pay to read that context. What happens in subsequent turns varies dramatically by model, effort, and steering variant.
Baseline: high effort drives big spikes
At 4.6 high baseline, the cache concentrated into two turns. Turn 1 (claudemd_summarise) wrote 57,837 tokens – 46.2 percent of the 125,317 session total. Turn 5 (tool_heavy_task) wrote 58,770 tokens – another 46.9 percent. At high effort, the model read files aggressively, and tool_heavy_task is what triggered it. Those two turns account for 93 percent of the entire session’s cache budget.
At 4.7 xhigh baseline, turn 1 wrote 79,026 tokens (70.3 percent of 112,395). But turn 8 – json_reshape, a structured data transformation that does not need file access at medium effort – wrote 23,528 tokens (20.9 percent). At xhigh, the model used tool calls even on tasks that did not strictly require them.
think-step-by-step: quiet for 12 turns, then a single enormous spike
At 4.7 xhigh, think-step-by-step produced 153,968 total cache tokens. Turn 1 contributed just 13,184 (8.6 percent). The session ran quietly for 12 turns. Then turn 13 – instruction_stress, a prompt that asks the model to satisfy five simultaneous constraints – wrote 108,808 tokens in one turn. That is 70.7 percent of the entire session’s cache budget in a single response.
That turn is also where the $1.11 single-prompt cost spike came from. The think-step-by-step wrapper told the model to reason carefully. On a complex constraint-stacking prompt at xhigh effort, “reason carefully” meant accumulating enormous context before answering. The cost did not spread across 10 prompts – it concentrated at the one that triggered the most reasoning.
For comparison, the same think-step-by-step wrapper on 4.6 high produced turn 1 at 9,498 tokens (46.4 percent) and no other turn above 3,600. Total cache: 20,452. The same steering text produced a fundamentally different session shape on the two models.
ultrathink: the spike moved to an earlier, different prompt
At 4.7 xhigh under ultrathink, turn 1 wrote 13,186 tokens (10.3 percent). Turn 3 – code_review – wrote 75,227 tokens, 58.9 percent of the 127,616 session total. Turn 10 (typescript_refactor) added another 23,867 tokens (18.7 percent). Three turns drove 88 percent of the cache.
That turn 3 spike is also visible in the per-prompt cost data. code_review under ultrathink cost $0.0735 on Opus 4.6 high and $0.7807 on Opus 4.7 xhigh – a 10.62x difference for a single prompt. The model treated a code review as a deep reasoning exercise requiring its full working context to be carried forward. At 4.6 high under the same wrapper, the same prompt wrote 1,701 tokens. ultrathink made 4.7 treat a code review like instruction_stress.
no-tools: flat, predictable, no surprises
Under no-tools, every turn was small and consistent. At 4.6 high, turn 1 wrote 9,497 tokens (50.6 percent) and the remaining nine turns averaged around 600 tokens each. At 4.7 xhigh, turn 1 wrote 13,185 tokens (69.8 percent) and the rest averaged under 700. No spikes. The cache profile was stable across both models and both effort levels because without tool calls, there was no mechanism for mid-session context accumulation.
This is why no-tools saved money even when output tokens went up: it did not just shorten the answer, it eliminated the events that caused the cache to balloon.
Thinking blocks: only Opus 4.7 responded to steering
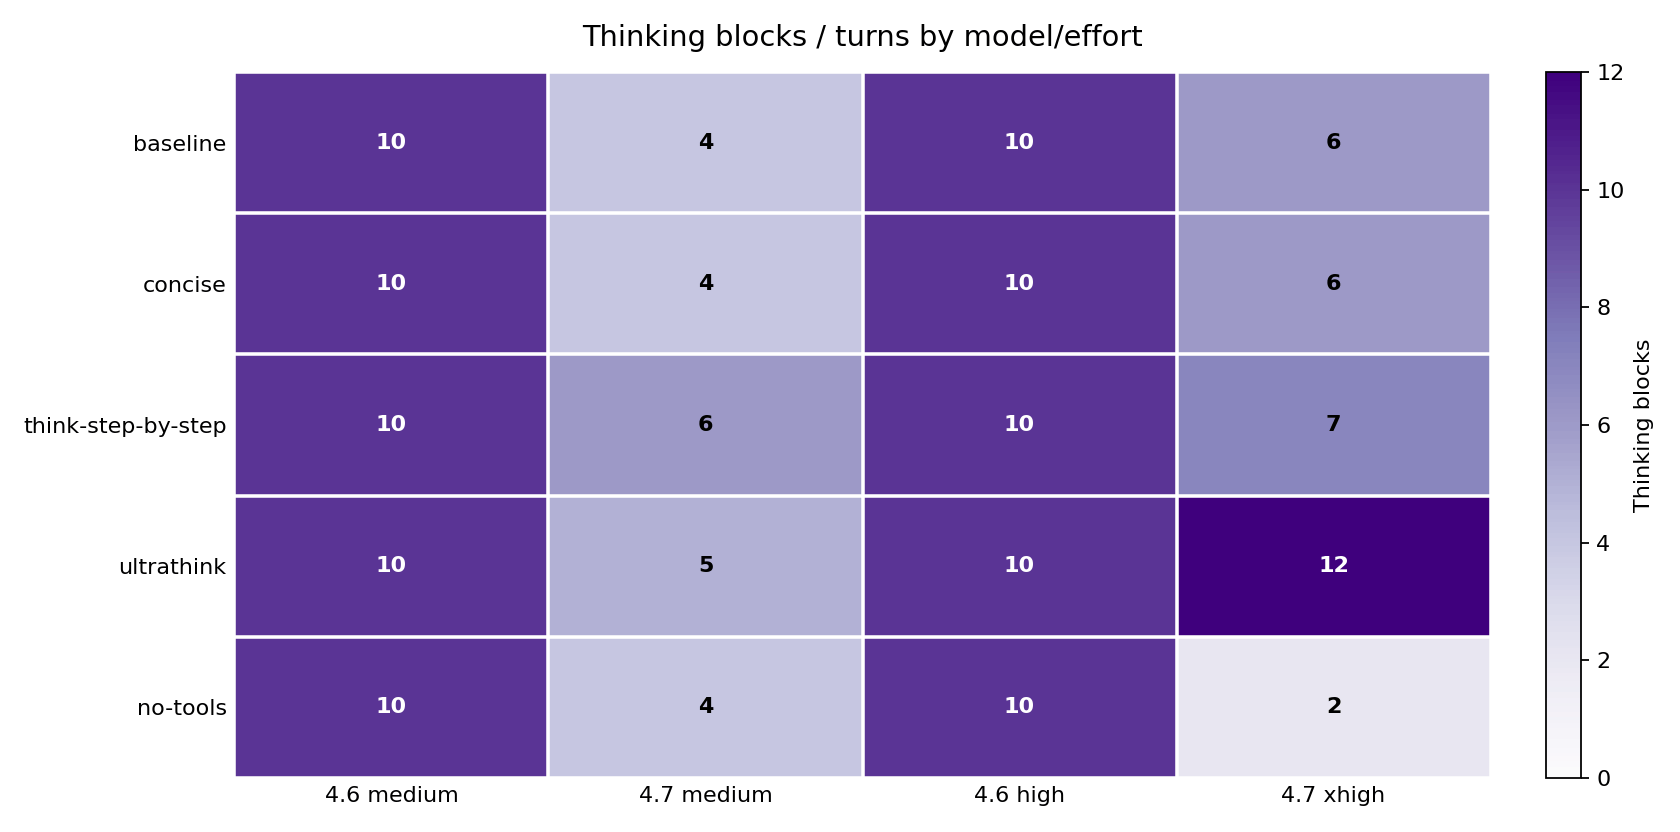
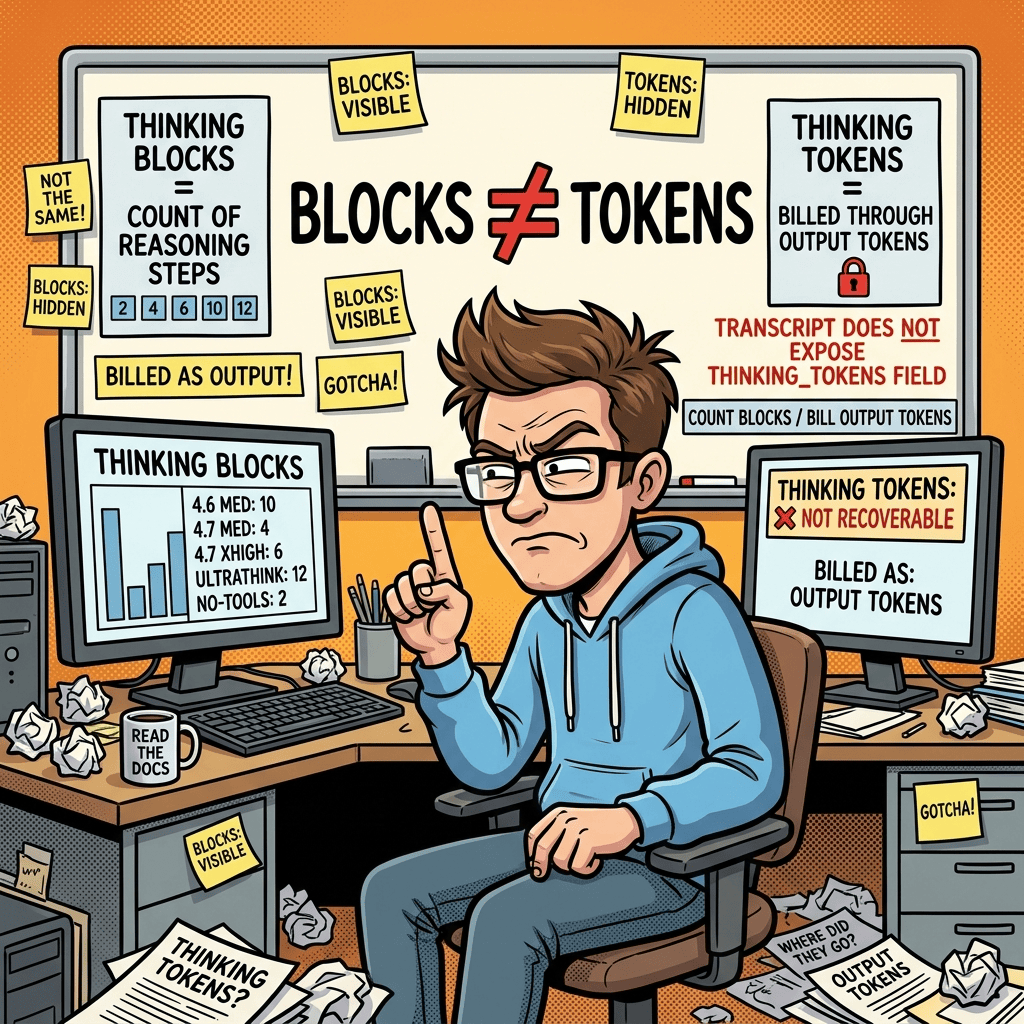
Thinking blocks are the model’s internal reasoning steps – visible in the transcript as structured reasoning before the final answer. They are counted here as blocks, not tokens, because Claude Code does not expose a separate recoverable thinking-token field. Thinking tokens are billed through output tokens in the billing data.
Opus 4.7 changed its thinking behavior noticeably based on the prompt wrapper. Medium baseline used 4 thinking blocks; xhigh baseline used 6; ultrathink at xhigh pushed to 12; no-tools at xhigh dropped to 2.
Opus 4.6 flatlined at exactly 10 thinking blocks in every single cell – baseline, concise, think-step-by-step, ultrathink, no-tools. The steering text had no measurable effect on its thinking-block count. If you are running Opus 4.6 and adding ultrathink or think-step-by-step expecting deeper reasoning, the block count evidence says nothing is changing. The extended-thinking response to prompt steering appears to be an Opus 4.7 behavior.
Latency: cheaper and faster usually went together, but not always
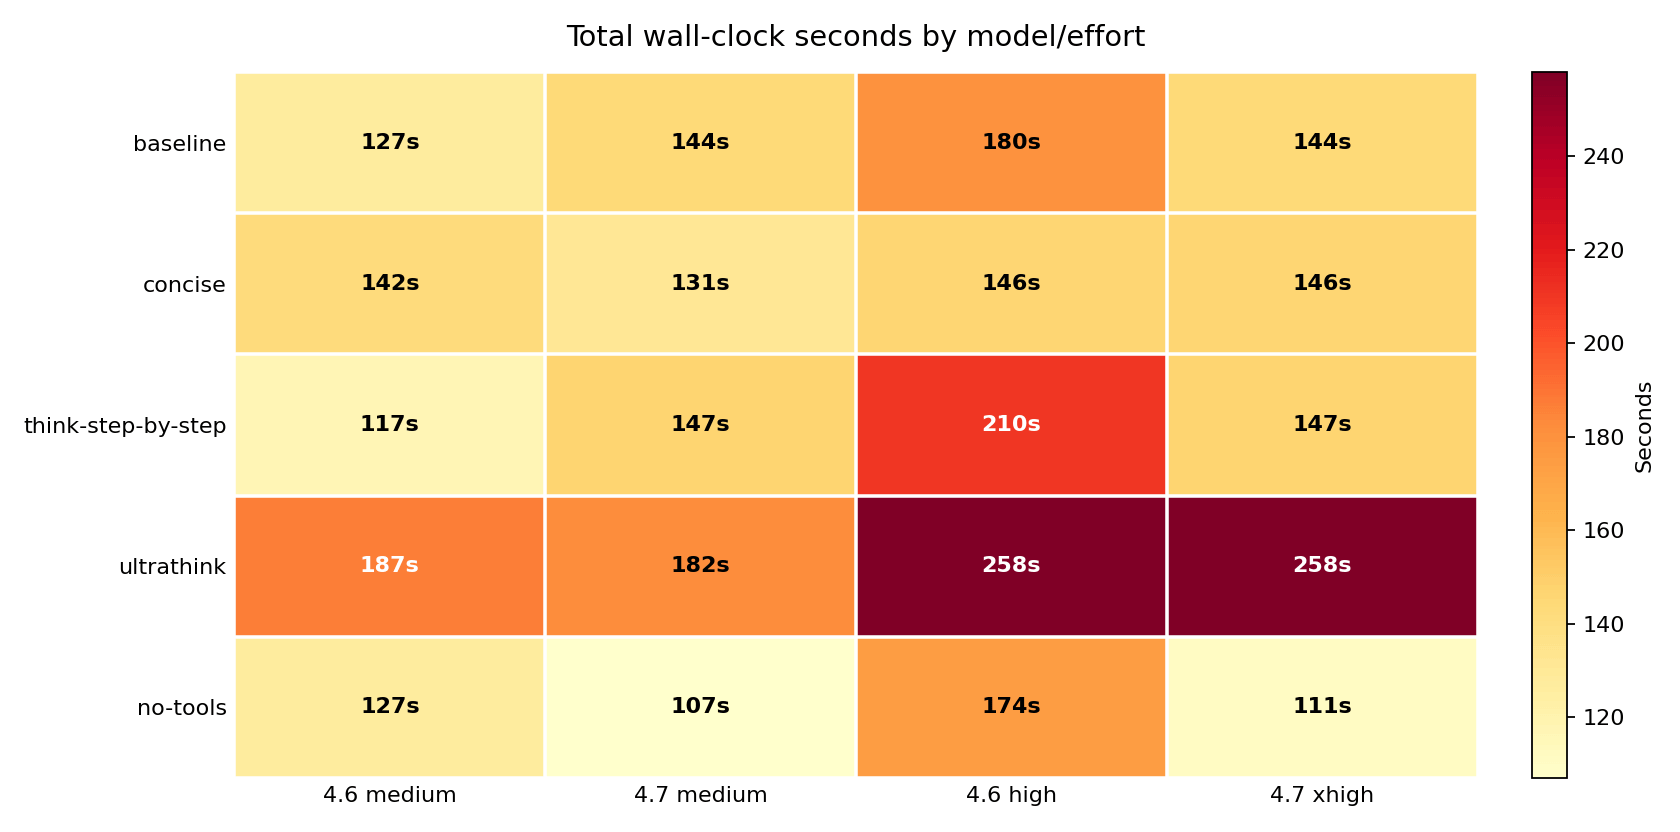
ultrathink was slow everywhere: 187s, 182s, 258s, and 258s across the four model/effort cells. no-tools was the fastest on Opus 4.7 – 107s at medium, 111s at xhigh. On Opus 4.6, no-tools had little latency effect; concise was the better latency lever there.
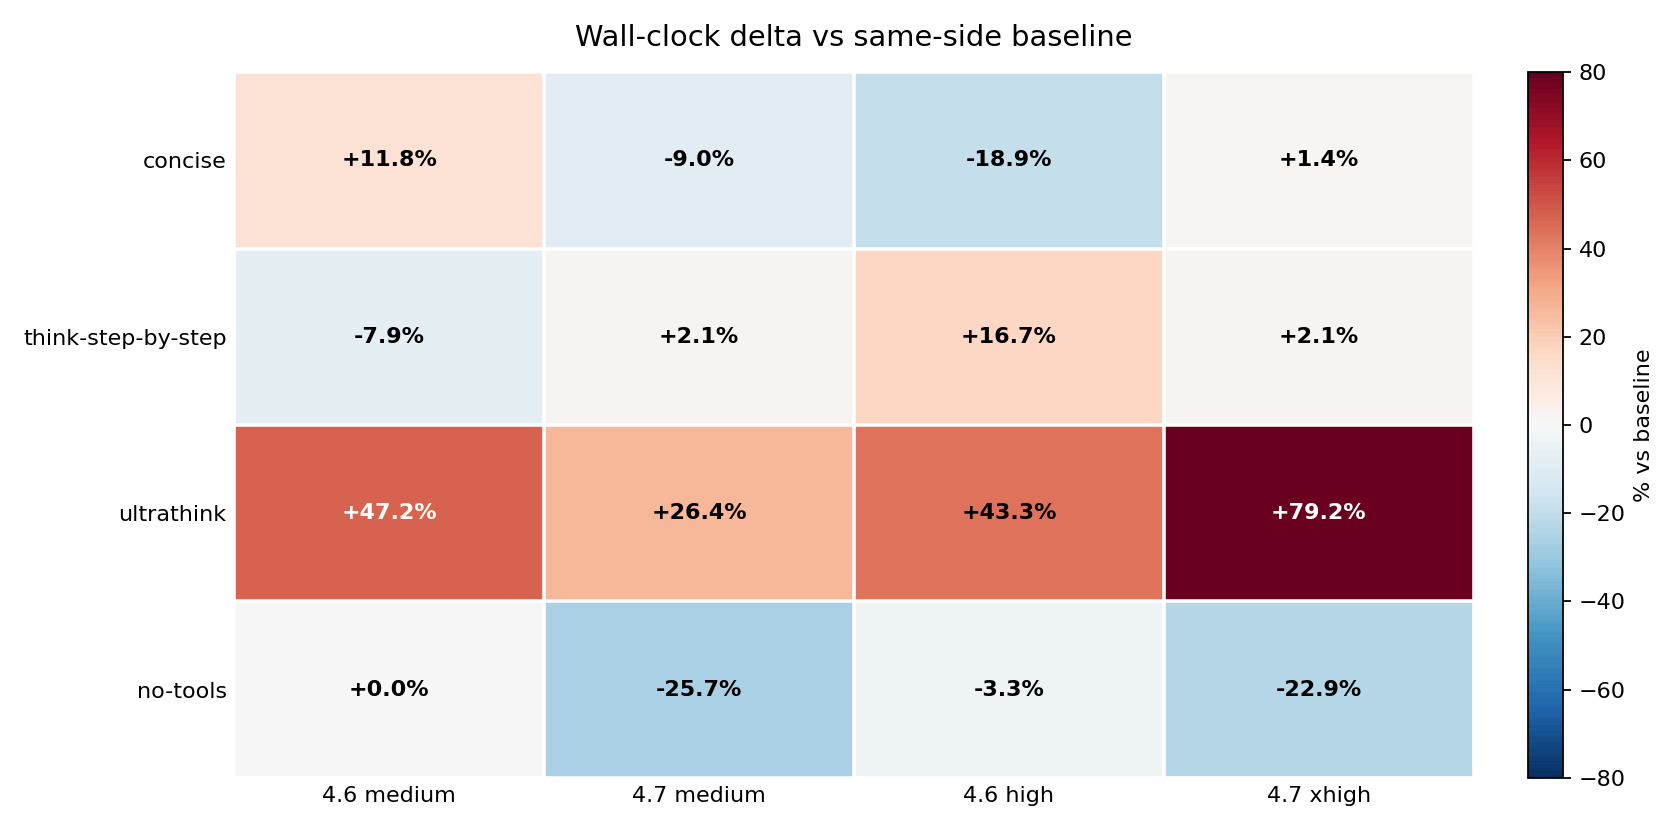
Compared to each model’s own baseline: ultrathink raised Opus 4.7 xhigh wall-clock by +79.2 percent. no-tools cut Opus 4.7 medium latency by 25.7 percent and Opus 4.7 xhigh by 22.9 percent. concise cut Opus 4.6 high by 18.9 percent.
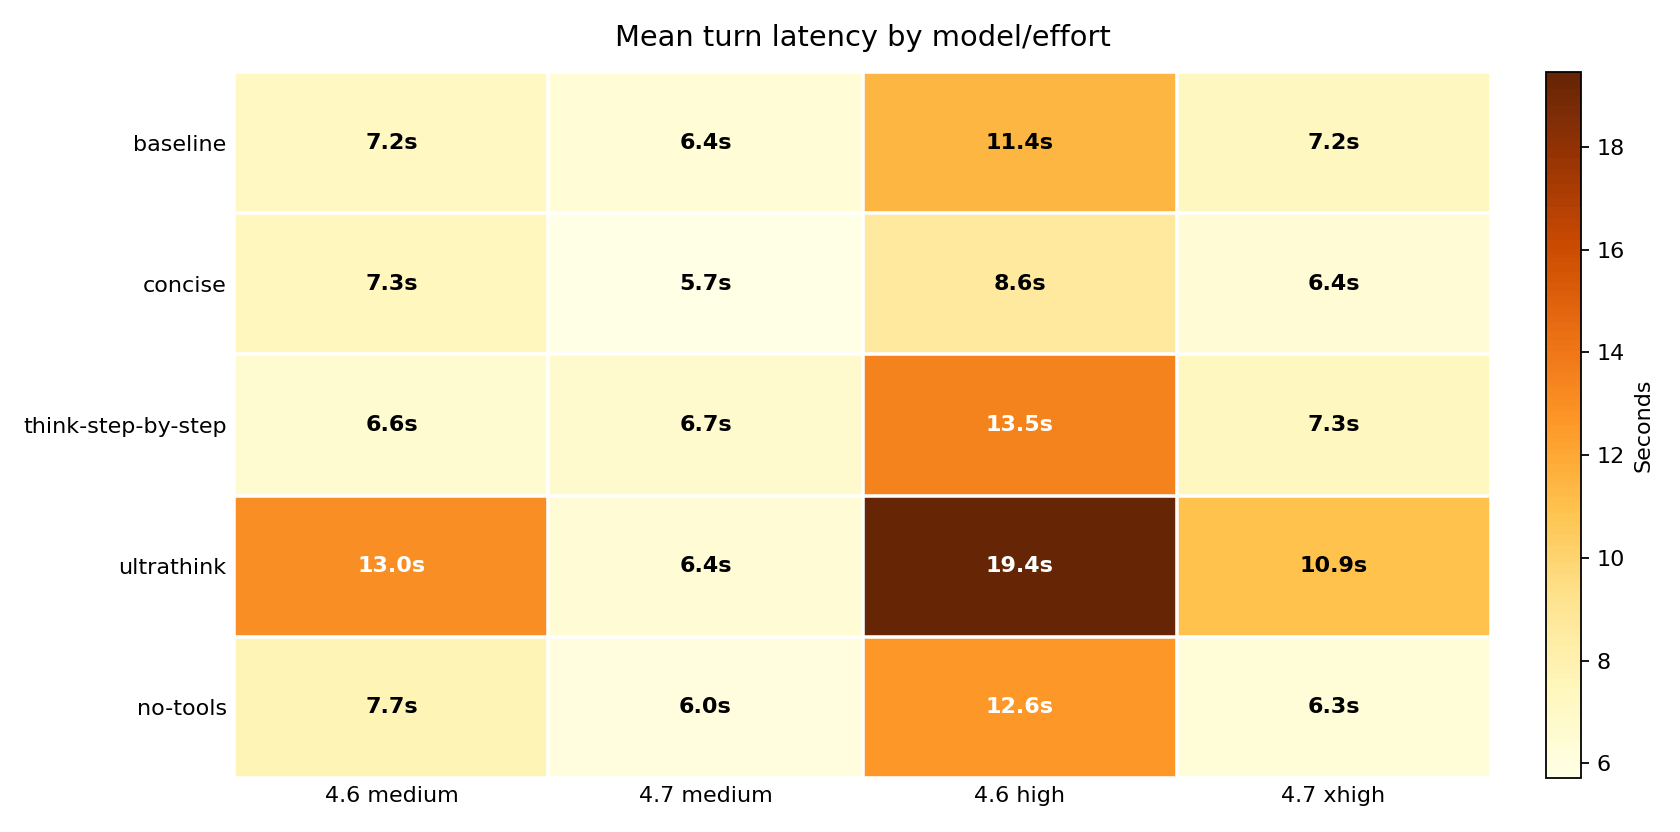
This chart separates “there were more steps” from “each step got slower.” Opus 4.6 high baseline averaged 11.41s per turn; ultrathink pushed that to 19.45s. Opus 4.7 xhigh averaged 7.23s per turn at baseline; ultrathink pushed it to 10.93s. The per-turn slowdown is separate from the extra turns – ultrathink made each response take longer, not just added more of them.
One prompt can dominate the whole session
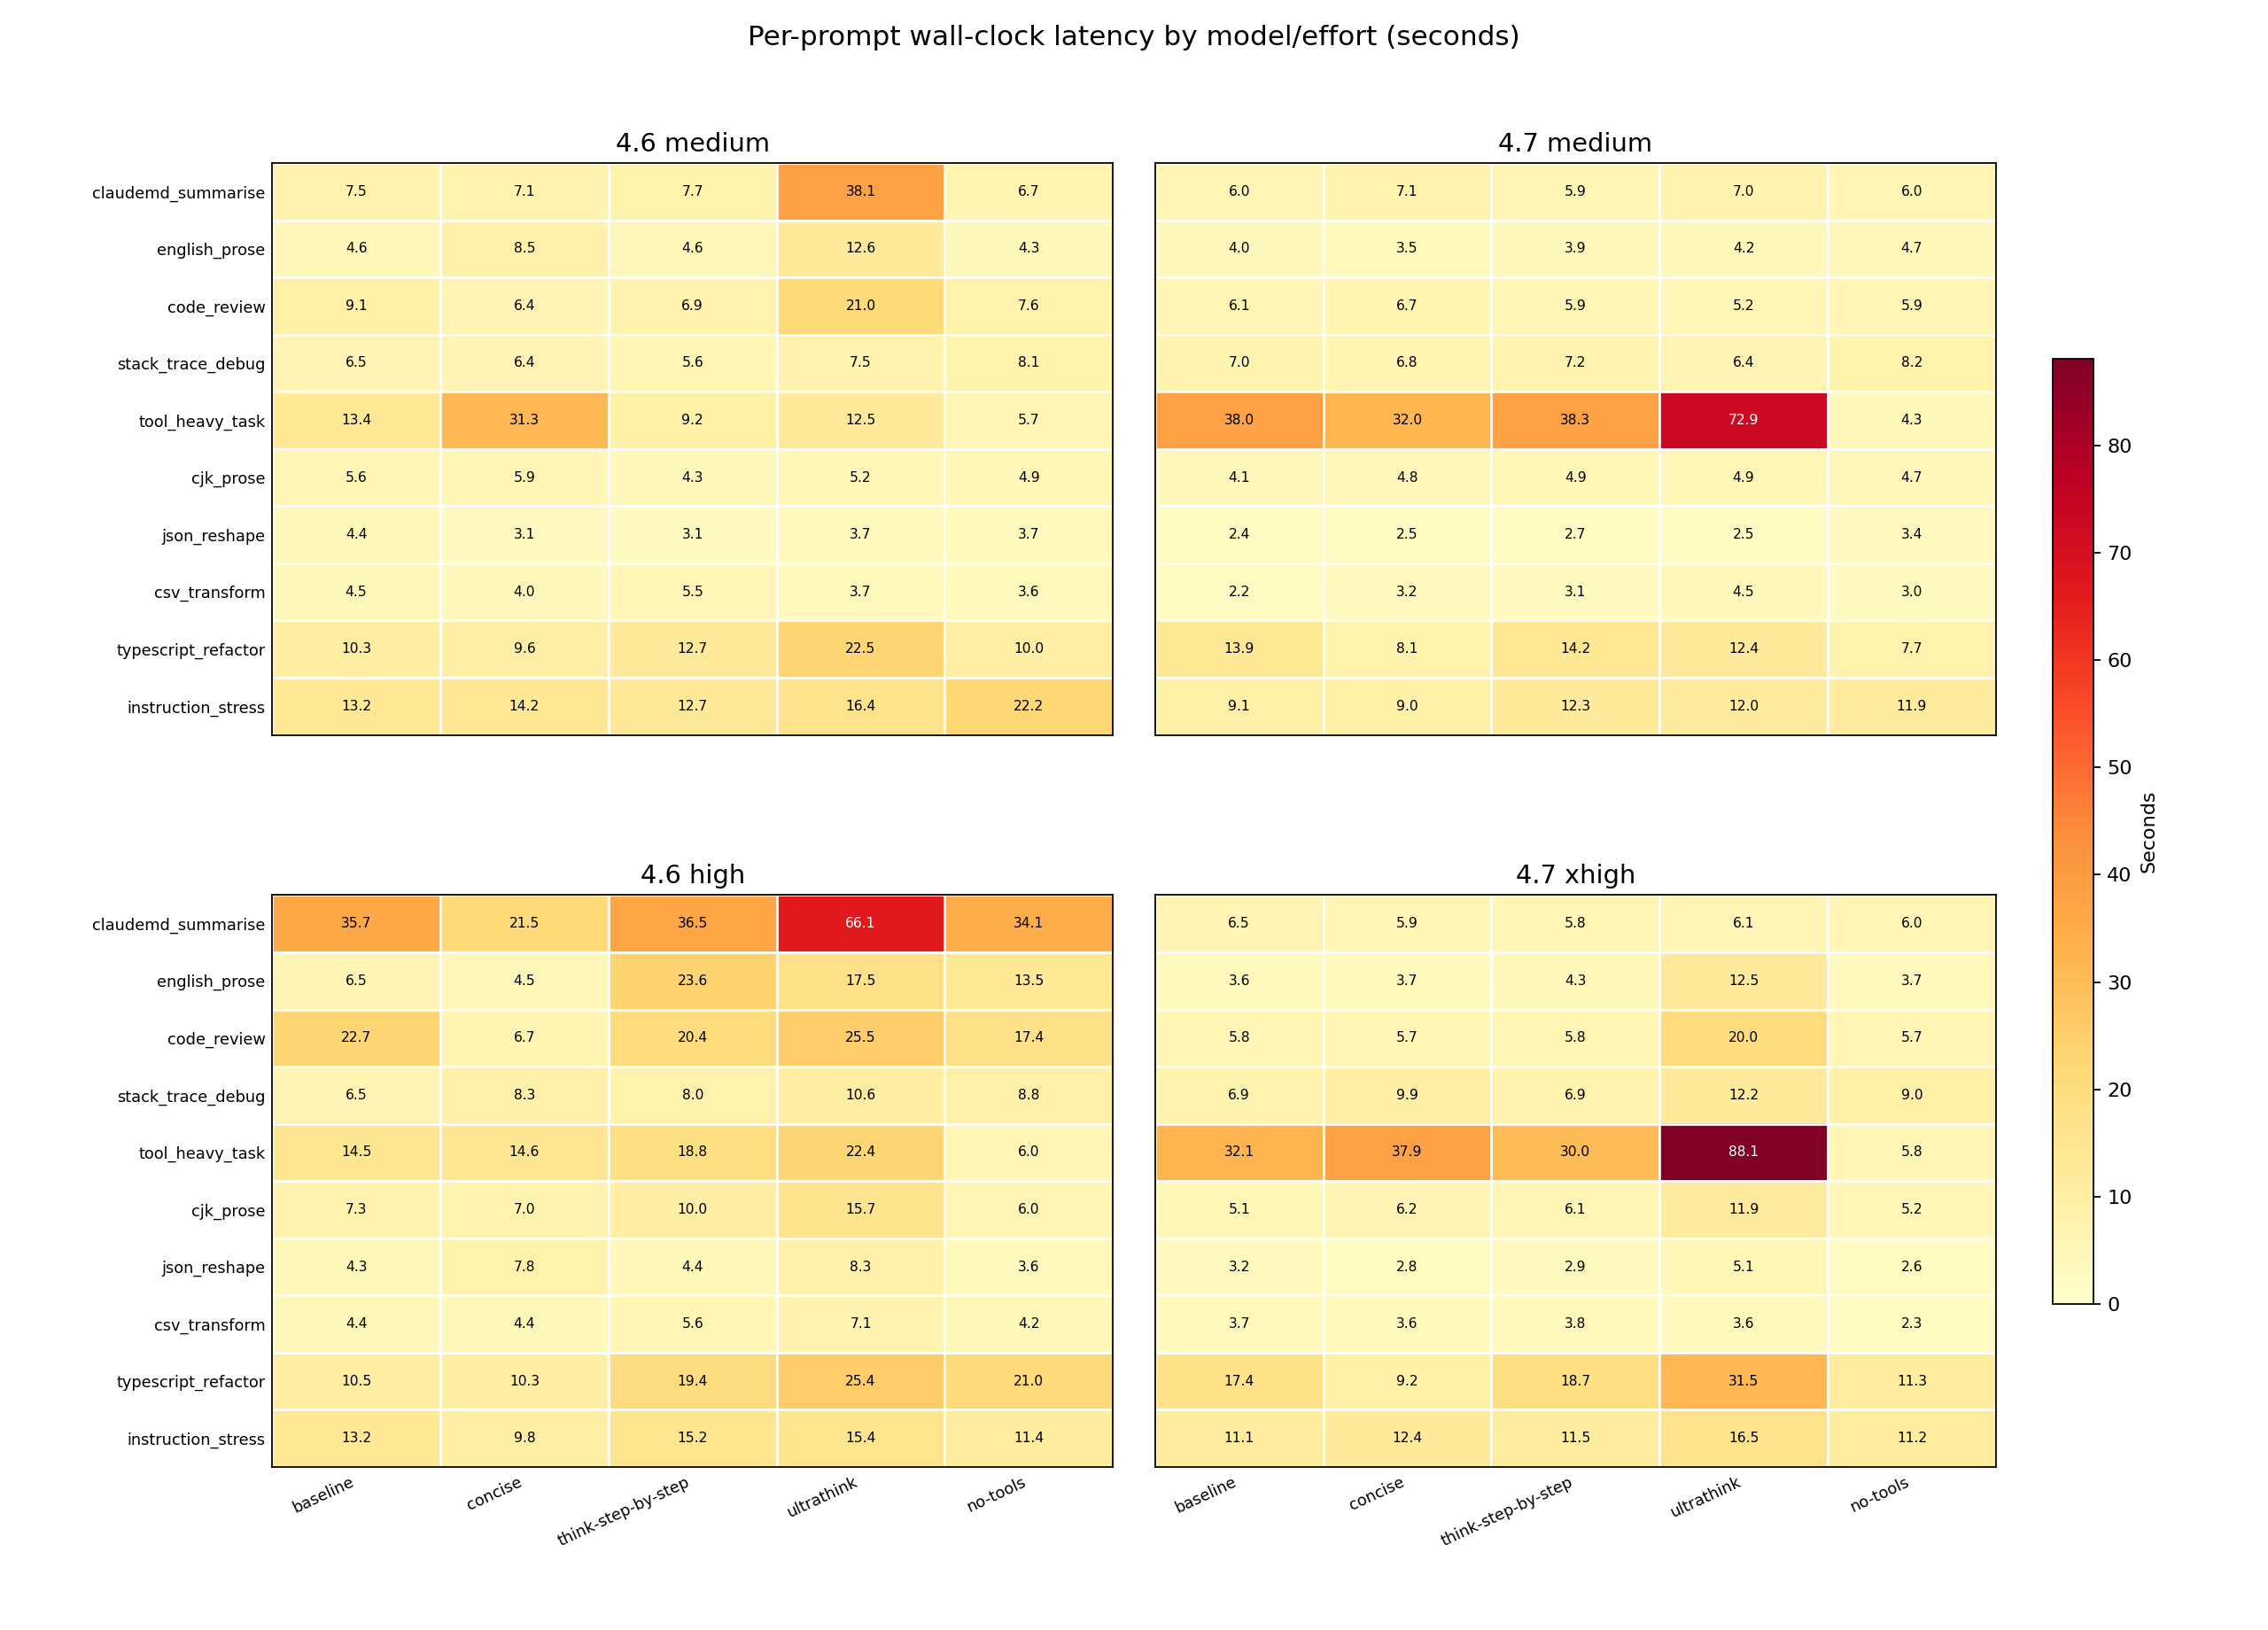
tool_heavy_task dominated Opus 4.7 latency under baseline, concise, think-step-by-step, and ultrathink. ultrathink also made claudemd_summarise and typescript_refactor visibly slower across several cells.
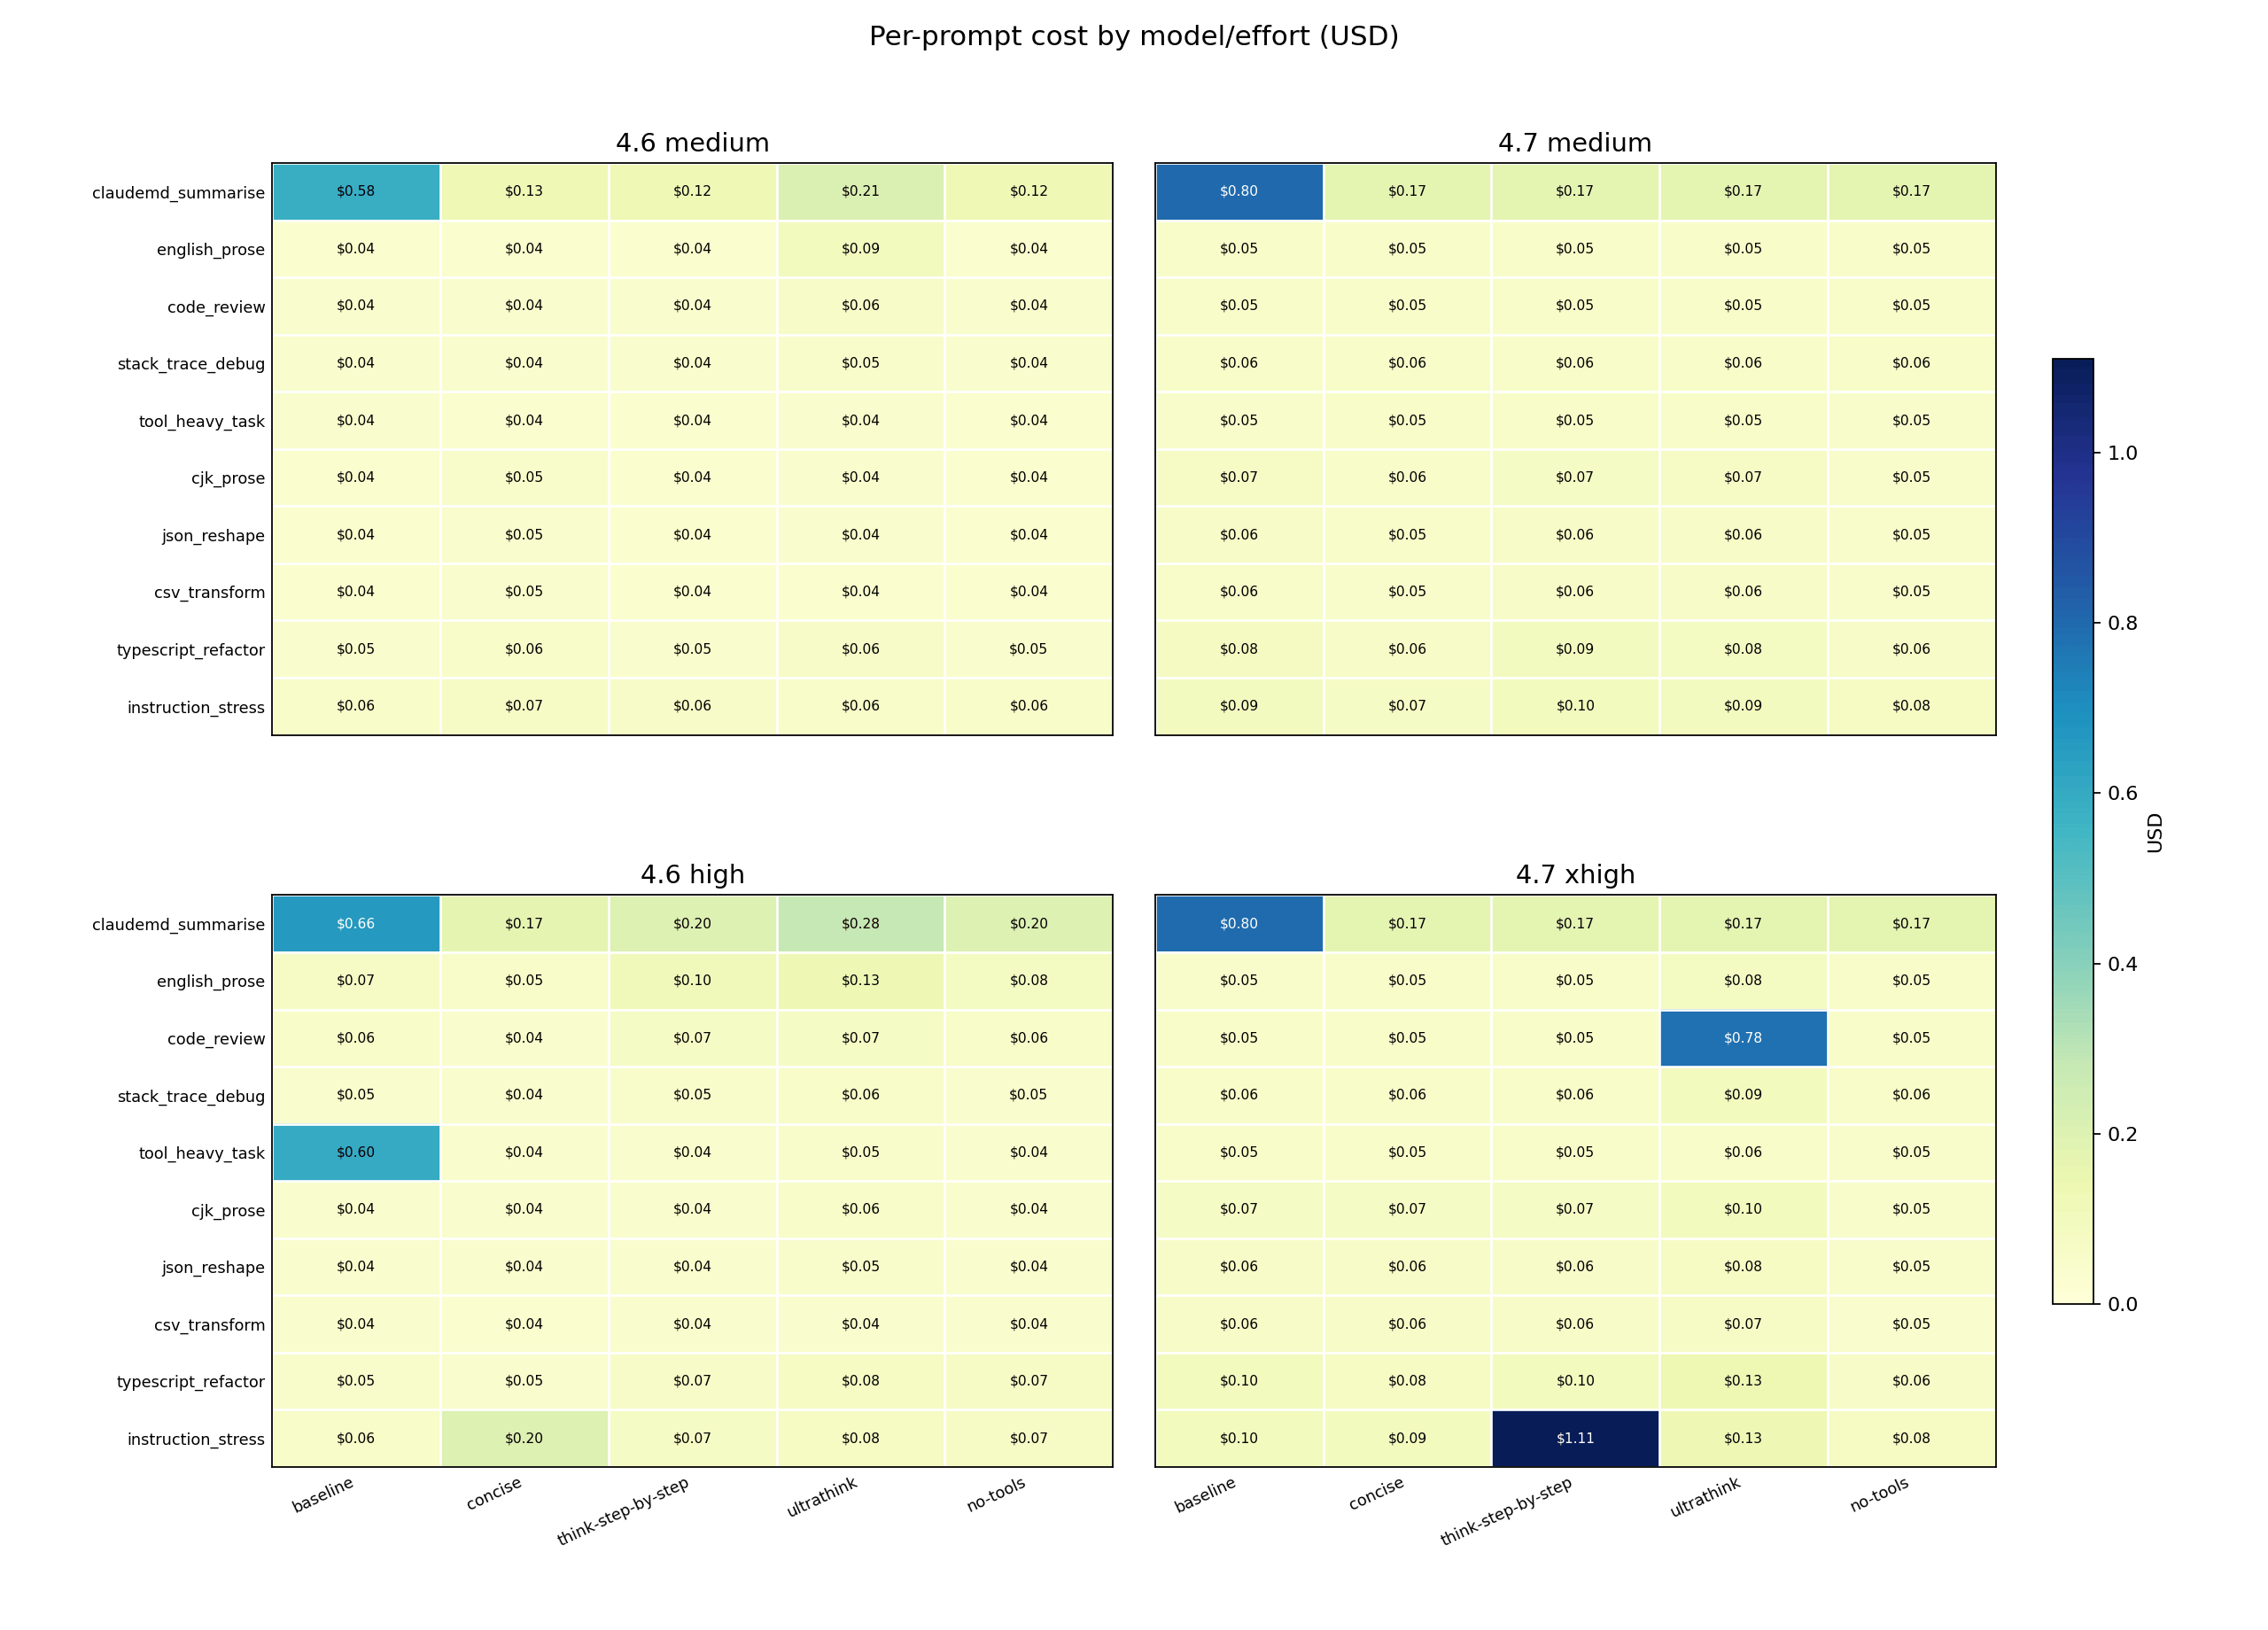
The two biggest single-prompt cost spikes both came from different wrappers hitting different prompts: instruction_stress under think-step-by-step at Opus 4.7 xhigh cost $1.11, and code_review under ultrathink cost $0.78. think-step-by-step detonated at turn 13 on a constraint-stacking prompt; ultrathink detonated at turn 3 on a code review. A wrapper that looks safe on average can still hide a prompt-specific cost spike. The session total masks it.
Opus 4.7 baseline also made claudemd_summarise expensive at around $0.80 – the session-opening context load, before any steering wrapper applies.

What the raw turn data confirmed
The session transcripts record every content block the model produced: thinking steps, tool calls, tool results, and text. This chart counts those blocks across each full 10-prompt session. no-tools removed tool-use and tool-result blocks entirely in every cell – zero, across all four model/effort combinations. Opus 4.7 xhigh under ultrathink reached 12 thinking blocks and 9 tool-use blocks: the most agentic and reasoning-heavy cell in the benchmark.
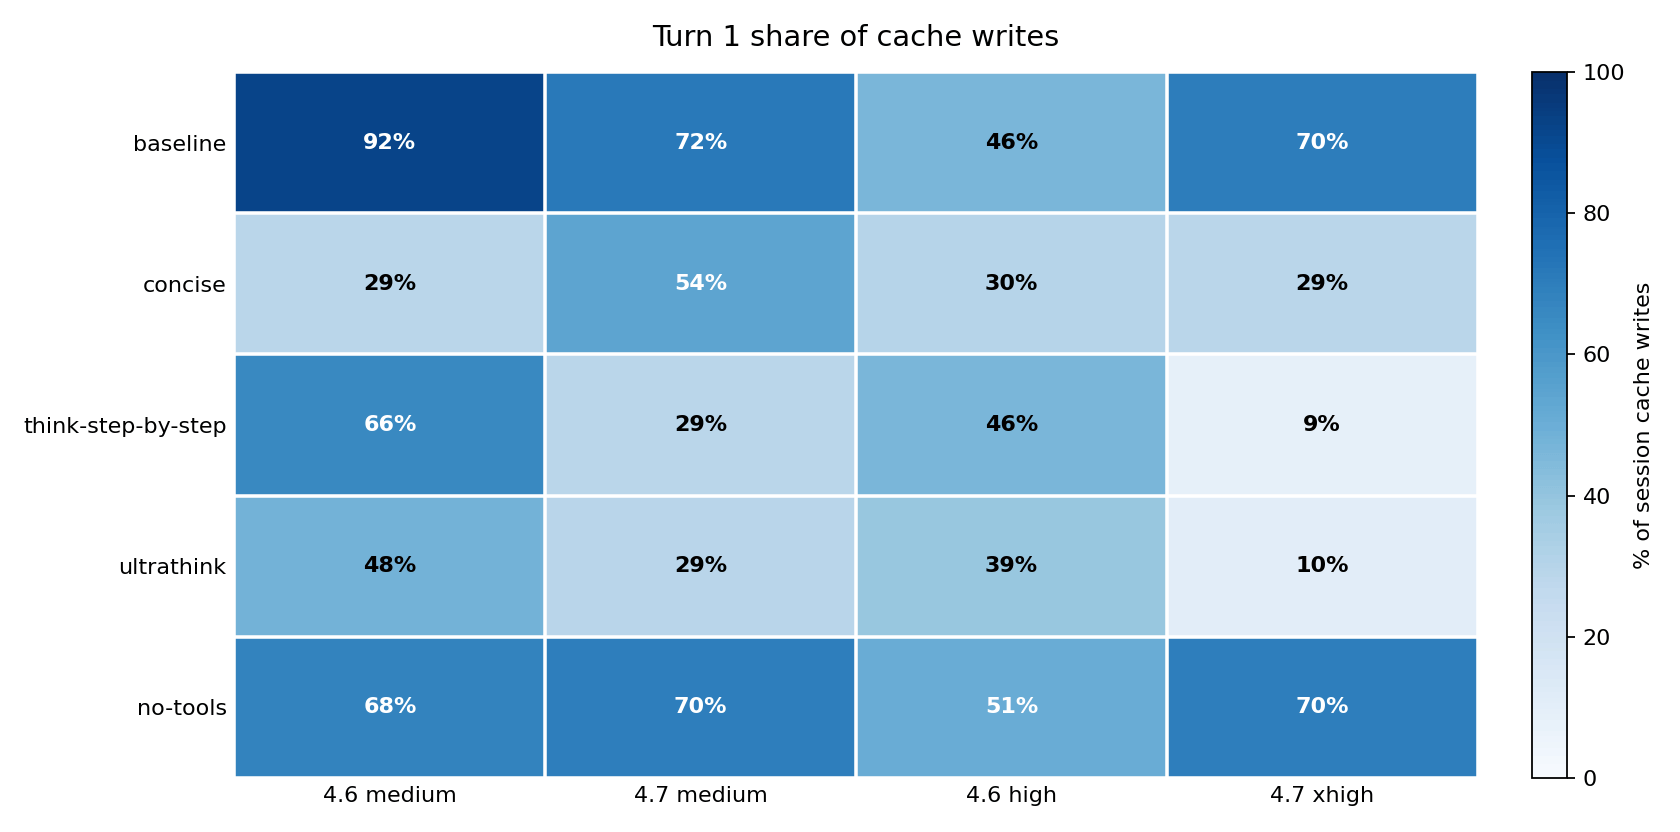
This is where the turn-by-turn cache write story crystallizes into a single chart. At baseline, most cache writes happened on turn 1: 92 percent for Opus 4.6 medium, 70 percent for Opus 4.7 xhigh. Under think-step-by-step and ultrathink on Opus 4.7 xhigh, only 9 to 10 percent of cache writes happened on turn 1. The reasoning wrappers shifted cache pressure from the session start to later turns – which is where the $1.11 instruction_stress spike and the $0.78 code_review write occurred. When cache writes scatter across later turns instead of front-loading, a single expensive prompt can reshape the whole session cost.
My recommendation from this run
Moving prompts from Opus 4.6 to Opus 4.7 is not a drop-in upgrade. The two models respond differently to the same steering text – in cost, in instruction-following, and in which direction each moves.
For direct-answer tasks – prose generation, code from an inline spec, data reshaping from inline content – test no-tools first. It is the strongest cost and latency lever in this benchmark. But verify the task does not need file access: on Opus 4.7, no-tools dropped instruction-following to 6/9 on every prompt that required a file read. Opus 4.6 high held 9/9.
For tasks that require tool use – codebase inspection, repository search, stack trace debugging – use concise instead. On Opus 4.6 high it cut cost 56.3 percent and latency 18.9 percent with instruction-following holding at 9/9 – same as baseline. On Opus 4.7 xhigh, cost dropped 29.8 percent and instruction-following held at 8/9. It is the only cost-reduction wrapper in this benchmark with no performance penalty on either model.
For multi-step reasoning tasks on Opus 4.7, do not add think-step-by-step or ultrathink without checking per-prompt cost first. Both raised cost 22 percent with instruction-following unchanged at 8/9 – same as baseline. You pay more. The model does not follow instructions any better.
For any workflow, track both cost and instruction-following at the per-prompt level. A session total that looks acceptable can still have one prompt dominating the bill under one wrapper and breaking an instruction constraint under another.
For Anthropic, maybe Claude Opus 4.7 needs to switch back to default a thinking tokens budget like Opus 4.6 and make adaptive thinking opt-in like Opus 4.6 to regain that degraded performance that some folks are complaining about?
What I learned
Prompt steering sets both cost and instruction-following. At baseline, Opus 4.7 costs 1.07x what Opus 4.6 costs – and scores 8/9 on instruction-following. Add no-tools, and cost falls to 0.99x but instruction-following drops to 6/9. Add concise, and cost falls to 1.41x with instruction-following holding at 8/9. The wrapper you choose sets both numbers simultaneously.
Cost and instruction-following do not move in lockstep. no-tools was the cheapest variant and the worst for instruction-following on Opus 4.7. concise was more expensive than no-tools but held instruction-following at baseline. Optimising for cost alone will send you toward no-tools; optimising for both will send you toward concise.
“Think harder” needs a reason. On Opus 4.7 xhigh, think-step-by-step and ultrathink both raised cost 22 percent with instruction-following flat at 8/9 – same as baseline. More expensive. No better at following instructions. The extra spend concentrated in one or two prompts per session, not spread evenly.
concise is the underrated option. It came within 4 pp of no-tools on cost for Opus 4.6 high, held 9/9 instruction-following, and suppressed nothing. The safest first thing to test on any workflow where tools are needed.
The bill is about cache writes, not answer length. Under think-step-by-step, the 4.7 cache write ratio was 7.53x higher than 4.6 on the same variant. Under no-tools, it was 1.01x. That gap explains almost all of the cost inversion.
Opus 4.6 held 9/9 instruction-following across all five variants. Even under no-tools at high effort, it passed every testable prompt. If instruction-following consistency matters more than cost, that is a meaningful data point for model choice.
To workaround deficiencies in one AI model, I never rely on a single AI model. I always have other AI models verify and consult with primary AI model to get a more well rounded response and understanding. I do this via my /consult-codex GPT-5.x skill and previously via my Gemini CLI MCP server.
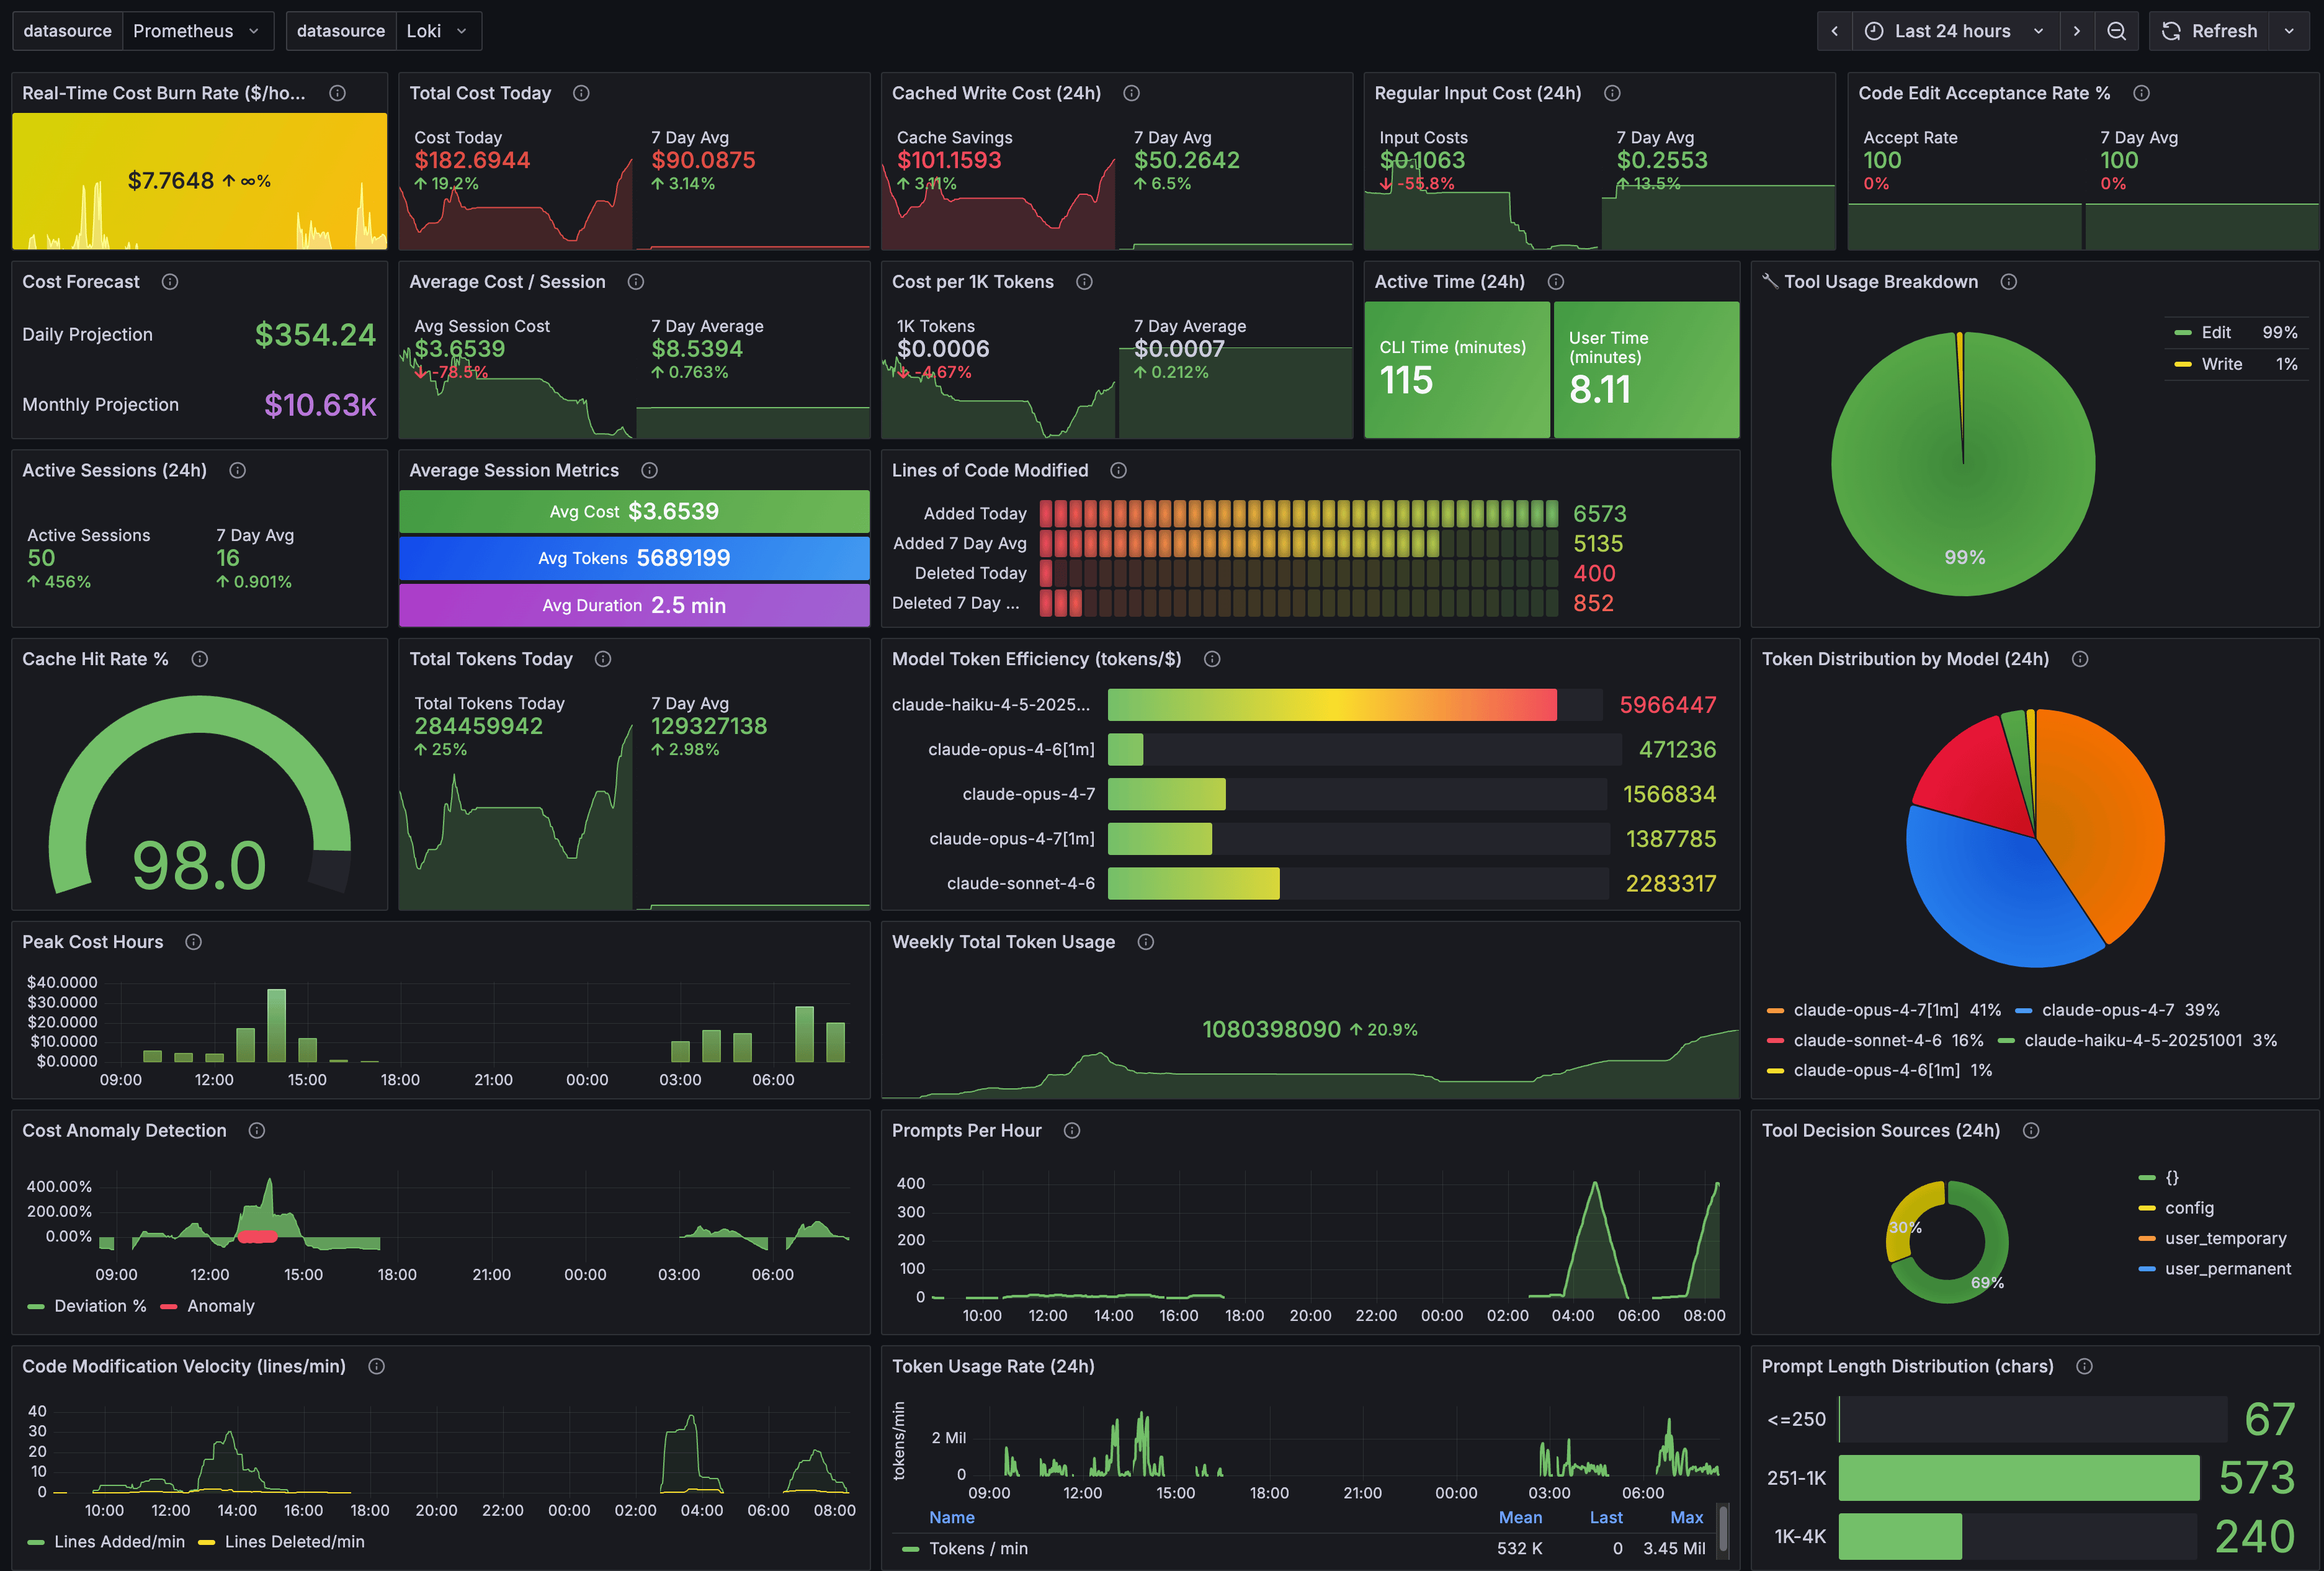
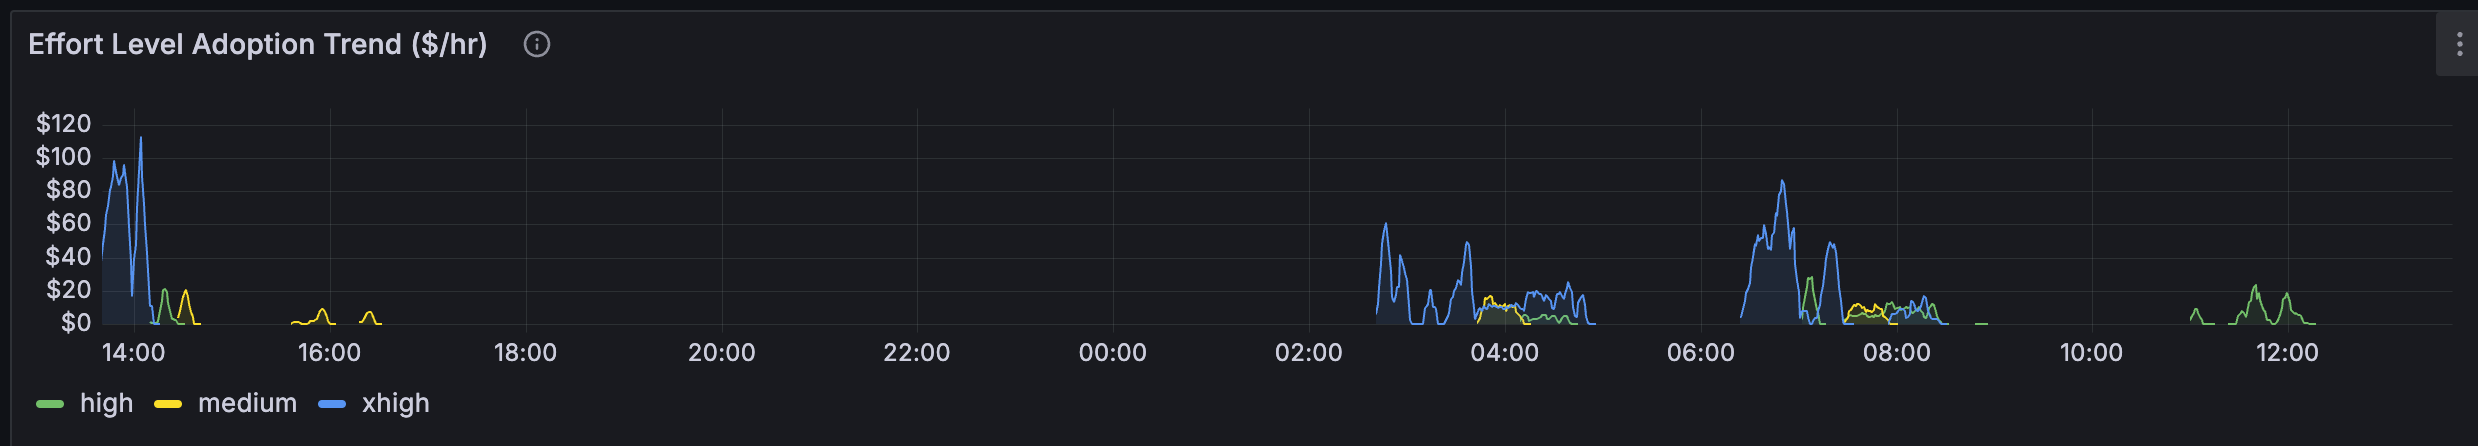
The 200 headless claude Code sessions ate into my 5hr session limit quickly - 2hrs in and hit my session usage limit! Here’s my Claude Code OpenTelemetry usage dashboard via Grafana, Prometheus, Loki setup - prompts per hour peaked at 407 prompts as I was also using Claude Code for other projects too at same time.
Token usage by Effort levels
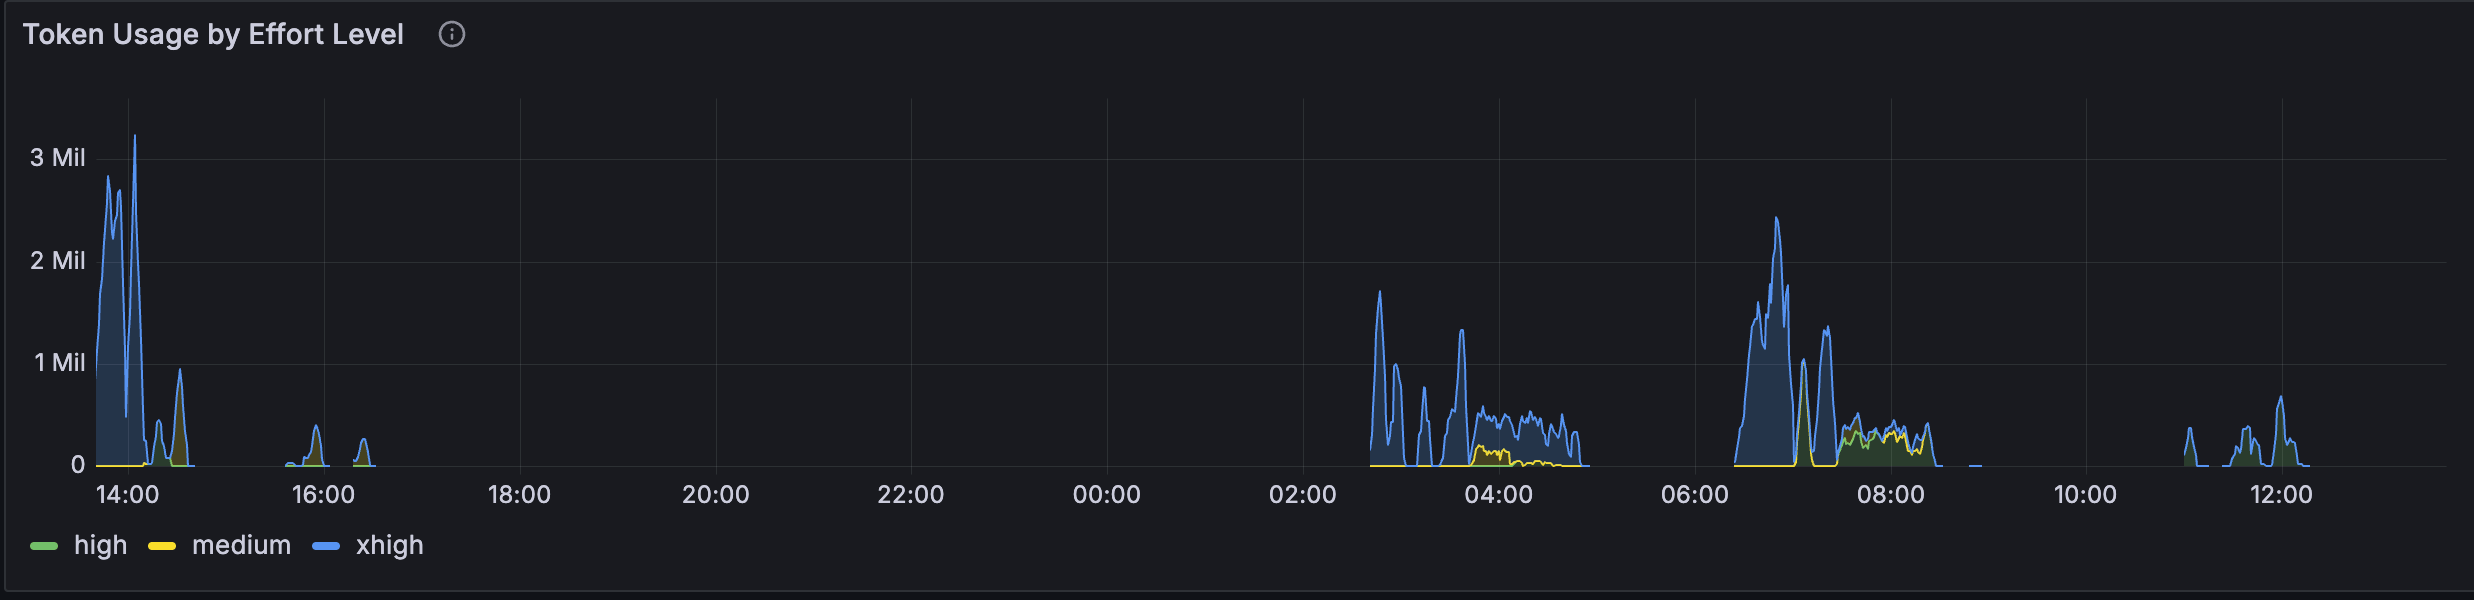
Token usage costs by Effort levels
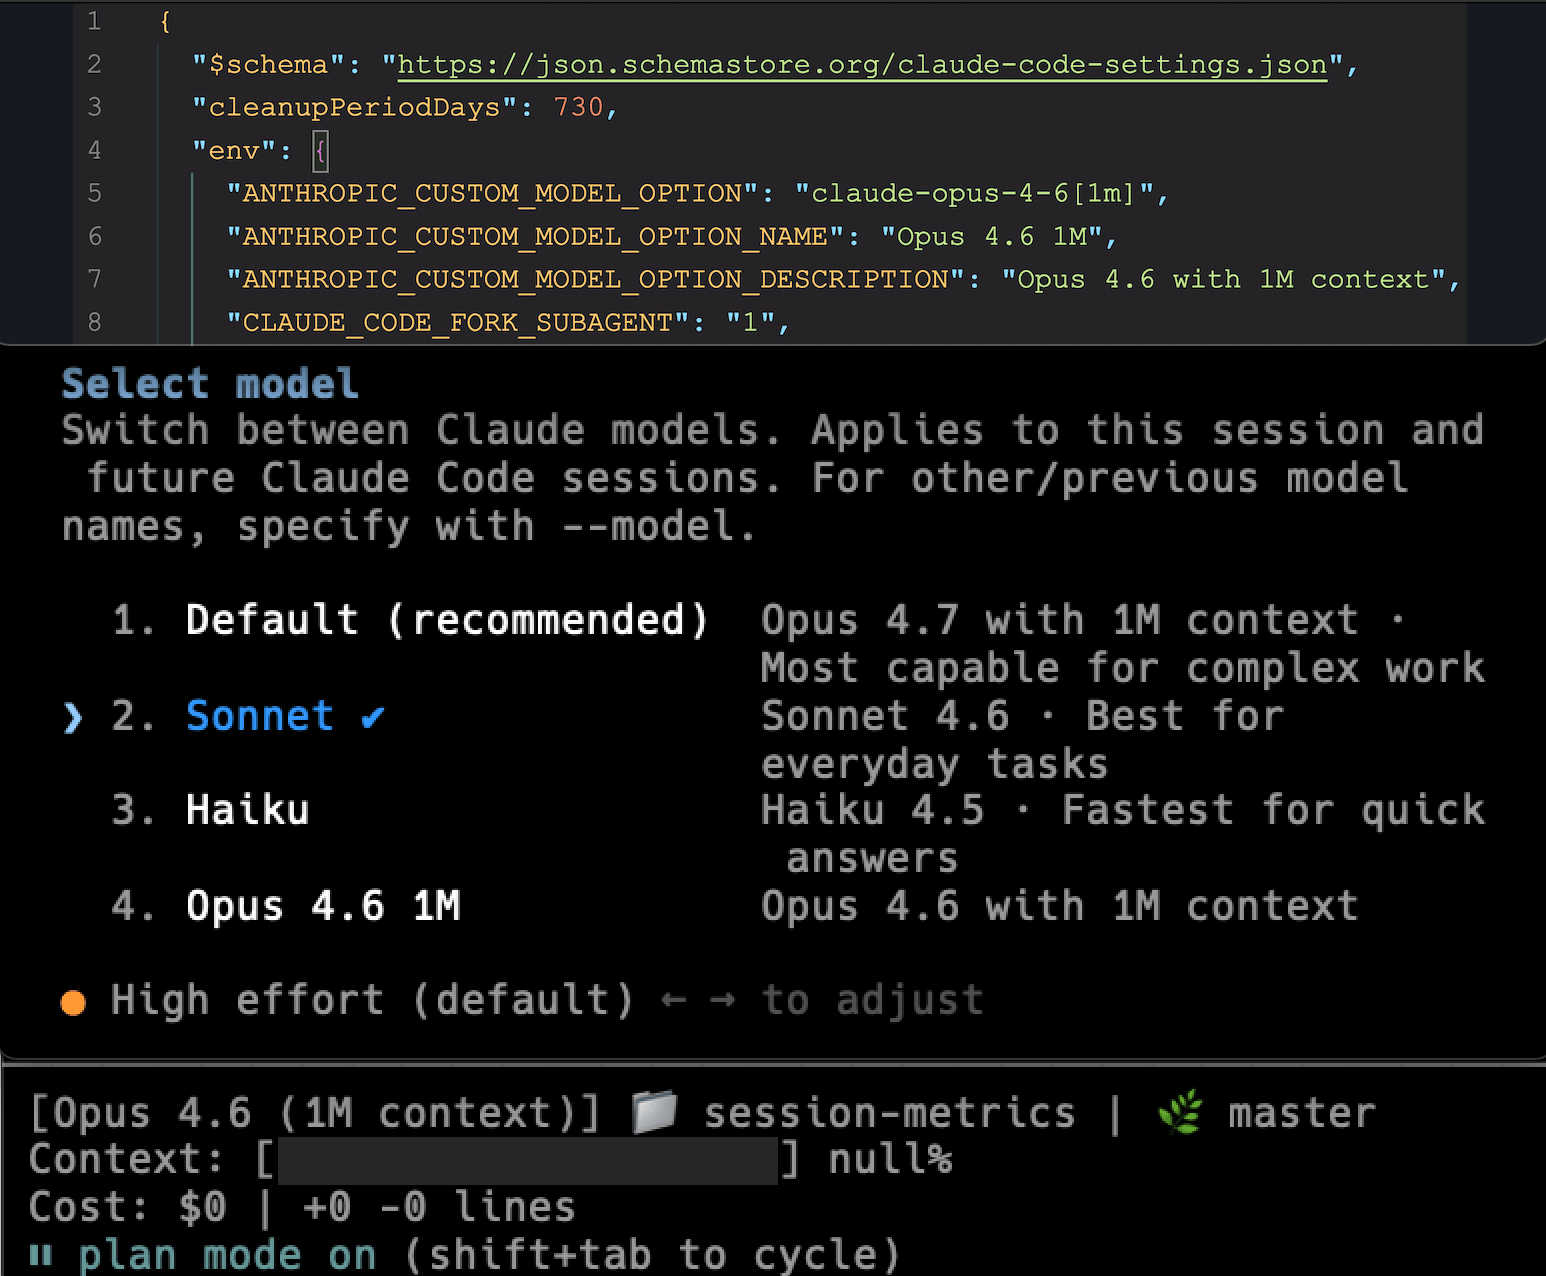
Or if you really want to go back to Claude Opus 4.6, set in your Claude Code CLI /model selection by adding to ~/.claude/settings.json config file environmental variables or pass —-model flag with claude-opus-4-6 or claude-opus-4-6[1m].
 "env": {
    "ANTHROPIC_CUSTOM_MODEL_OPTION": "claude-opus-4-6[1m]",
    "ANTHROPIC_CUSTOM_MODEL_OPTION_NAME": "Opus 4.6 1M",
    "ANTHROPIC_CUSTOM_MODEL_OPTION_DESCRIPTION": "Opus 4.6 with 1M context",
}
Compared To OpenAI GPT-5.4 & GPT-5.5
If you managed to read to this point of the article, here’s the bonus content. I was curious how do the 10 prompts compare for OpenAI’s GPT-5.4 and GPT-5.5? I decided to do some quick tests in Codex app for MacOS for GPT-5.4 medium/high and GPT-5.5 medium/high for baseline variant.
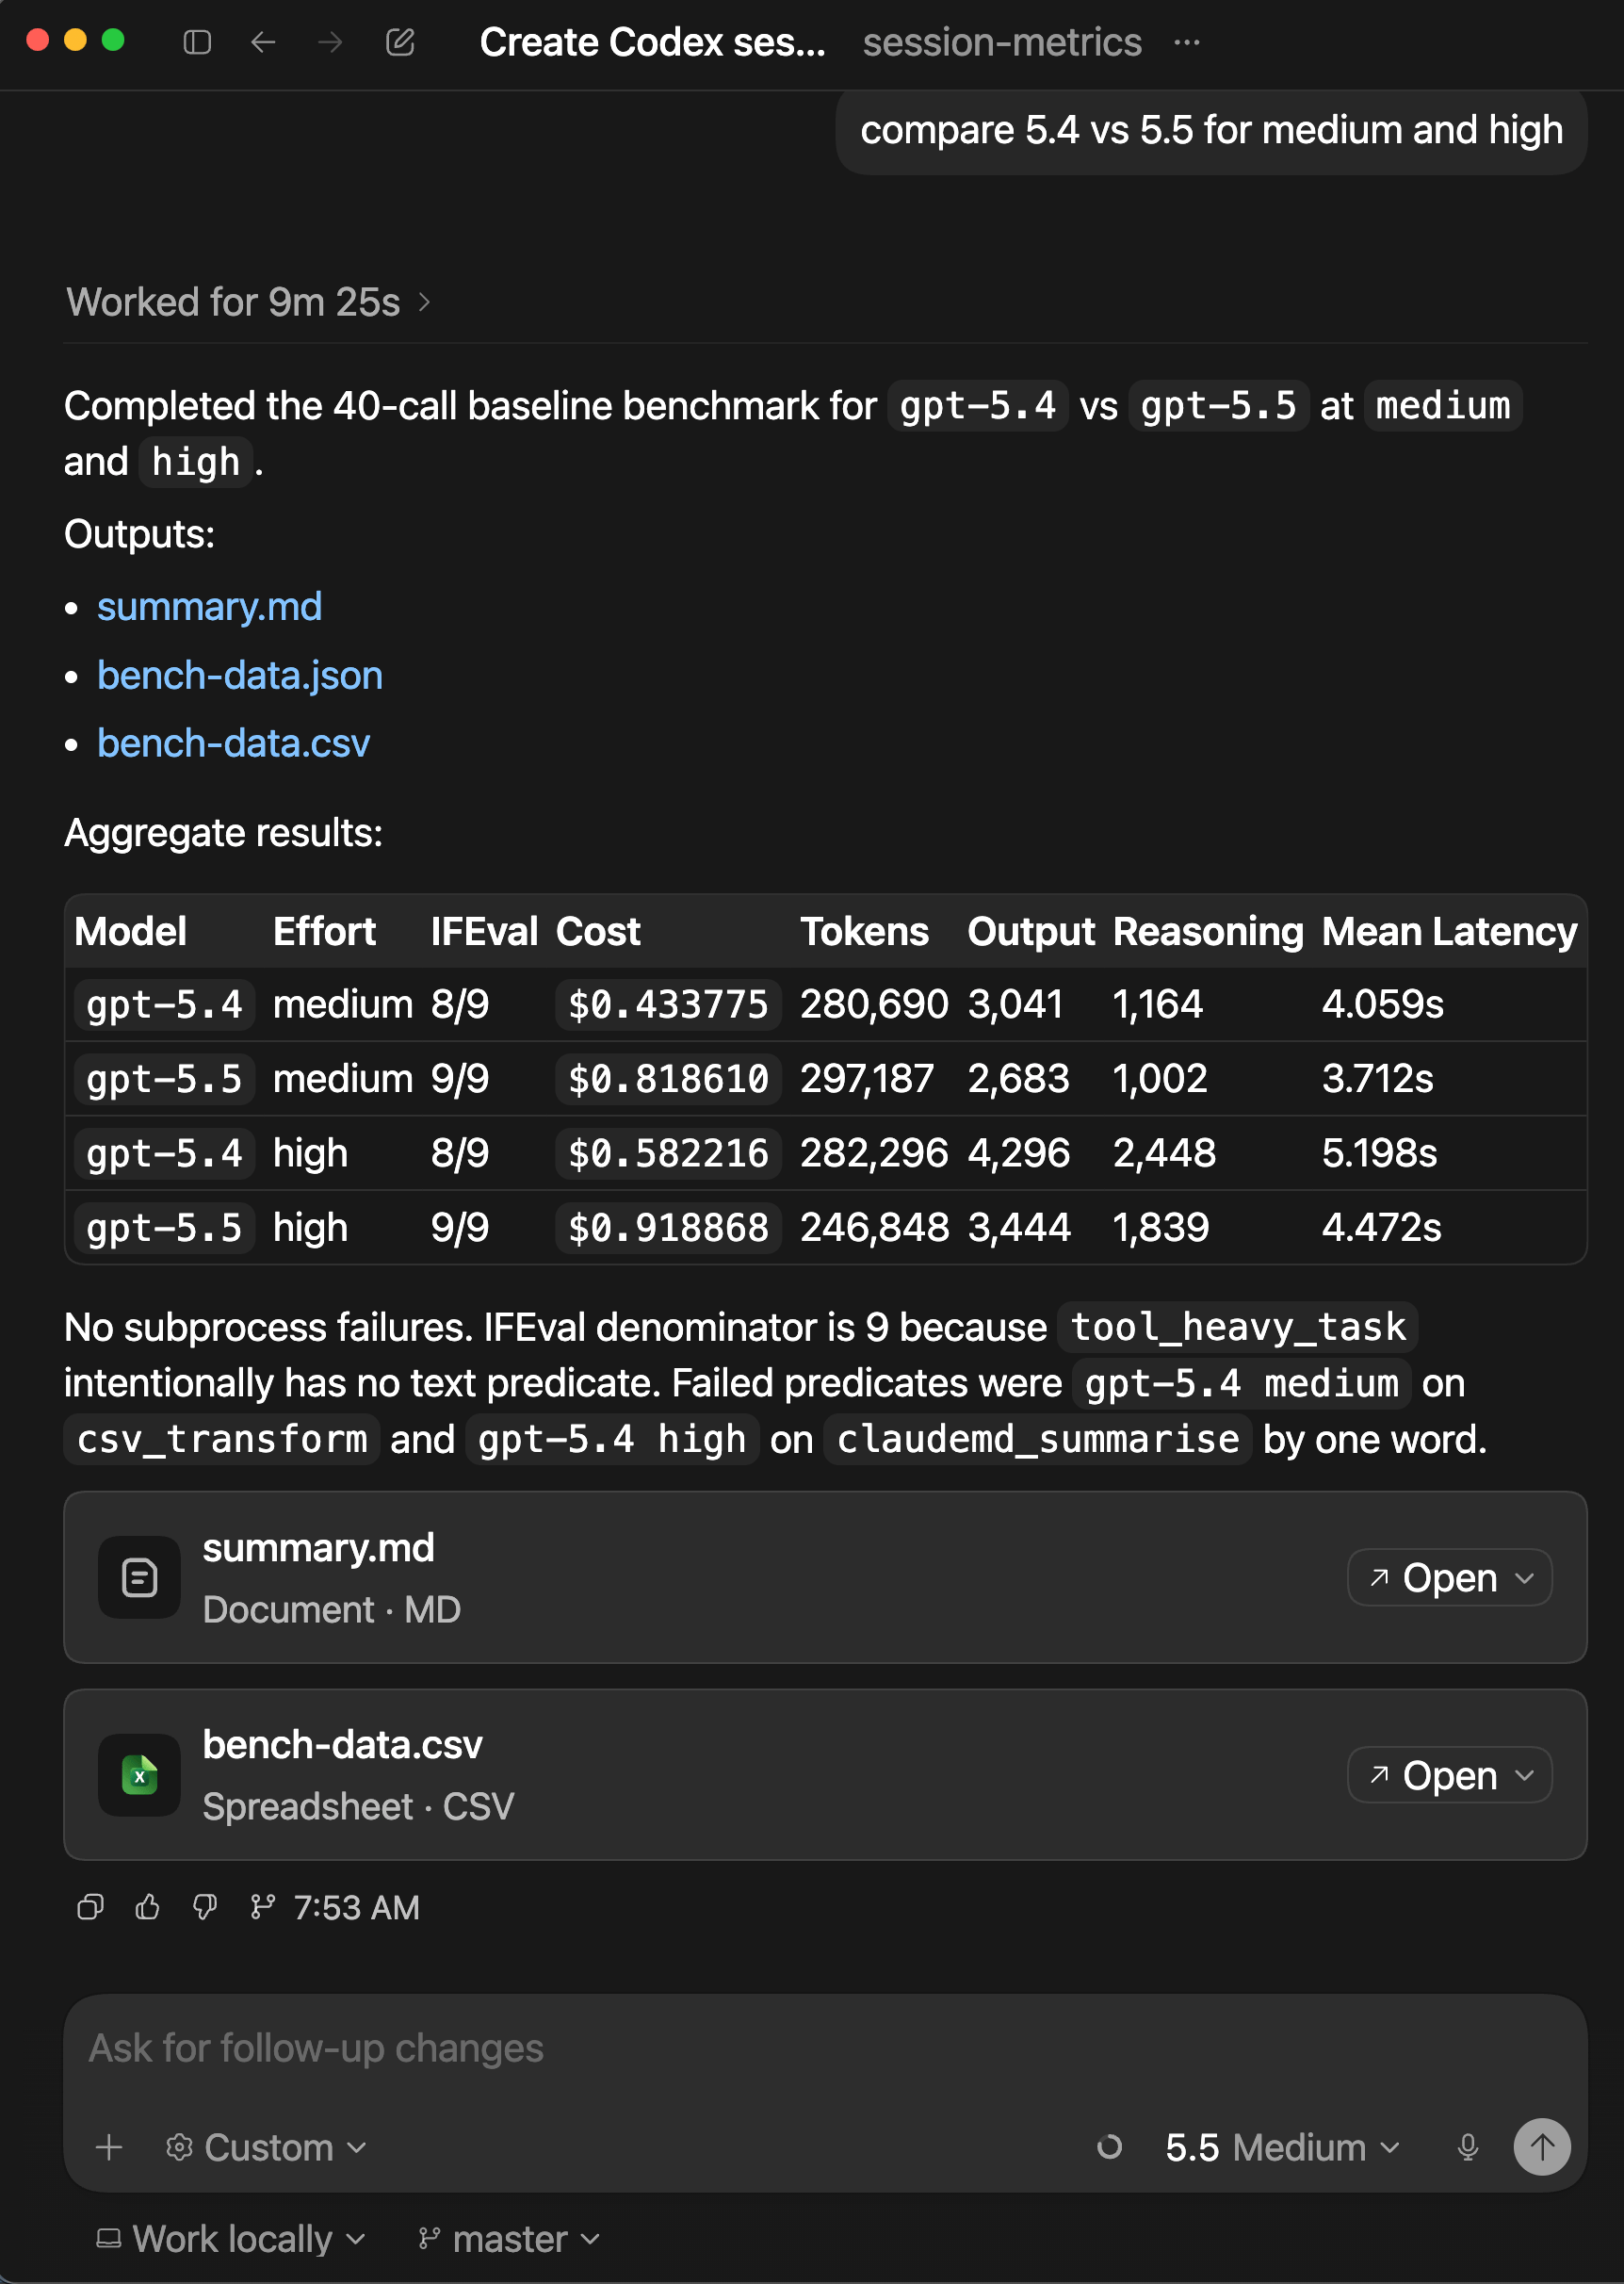
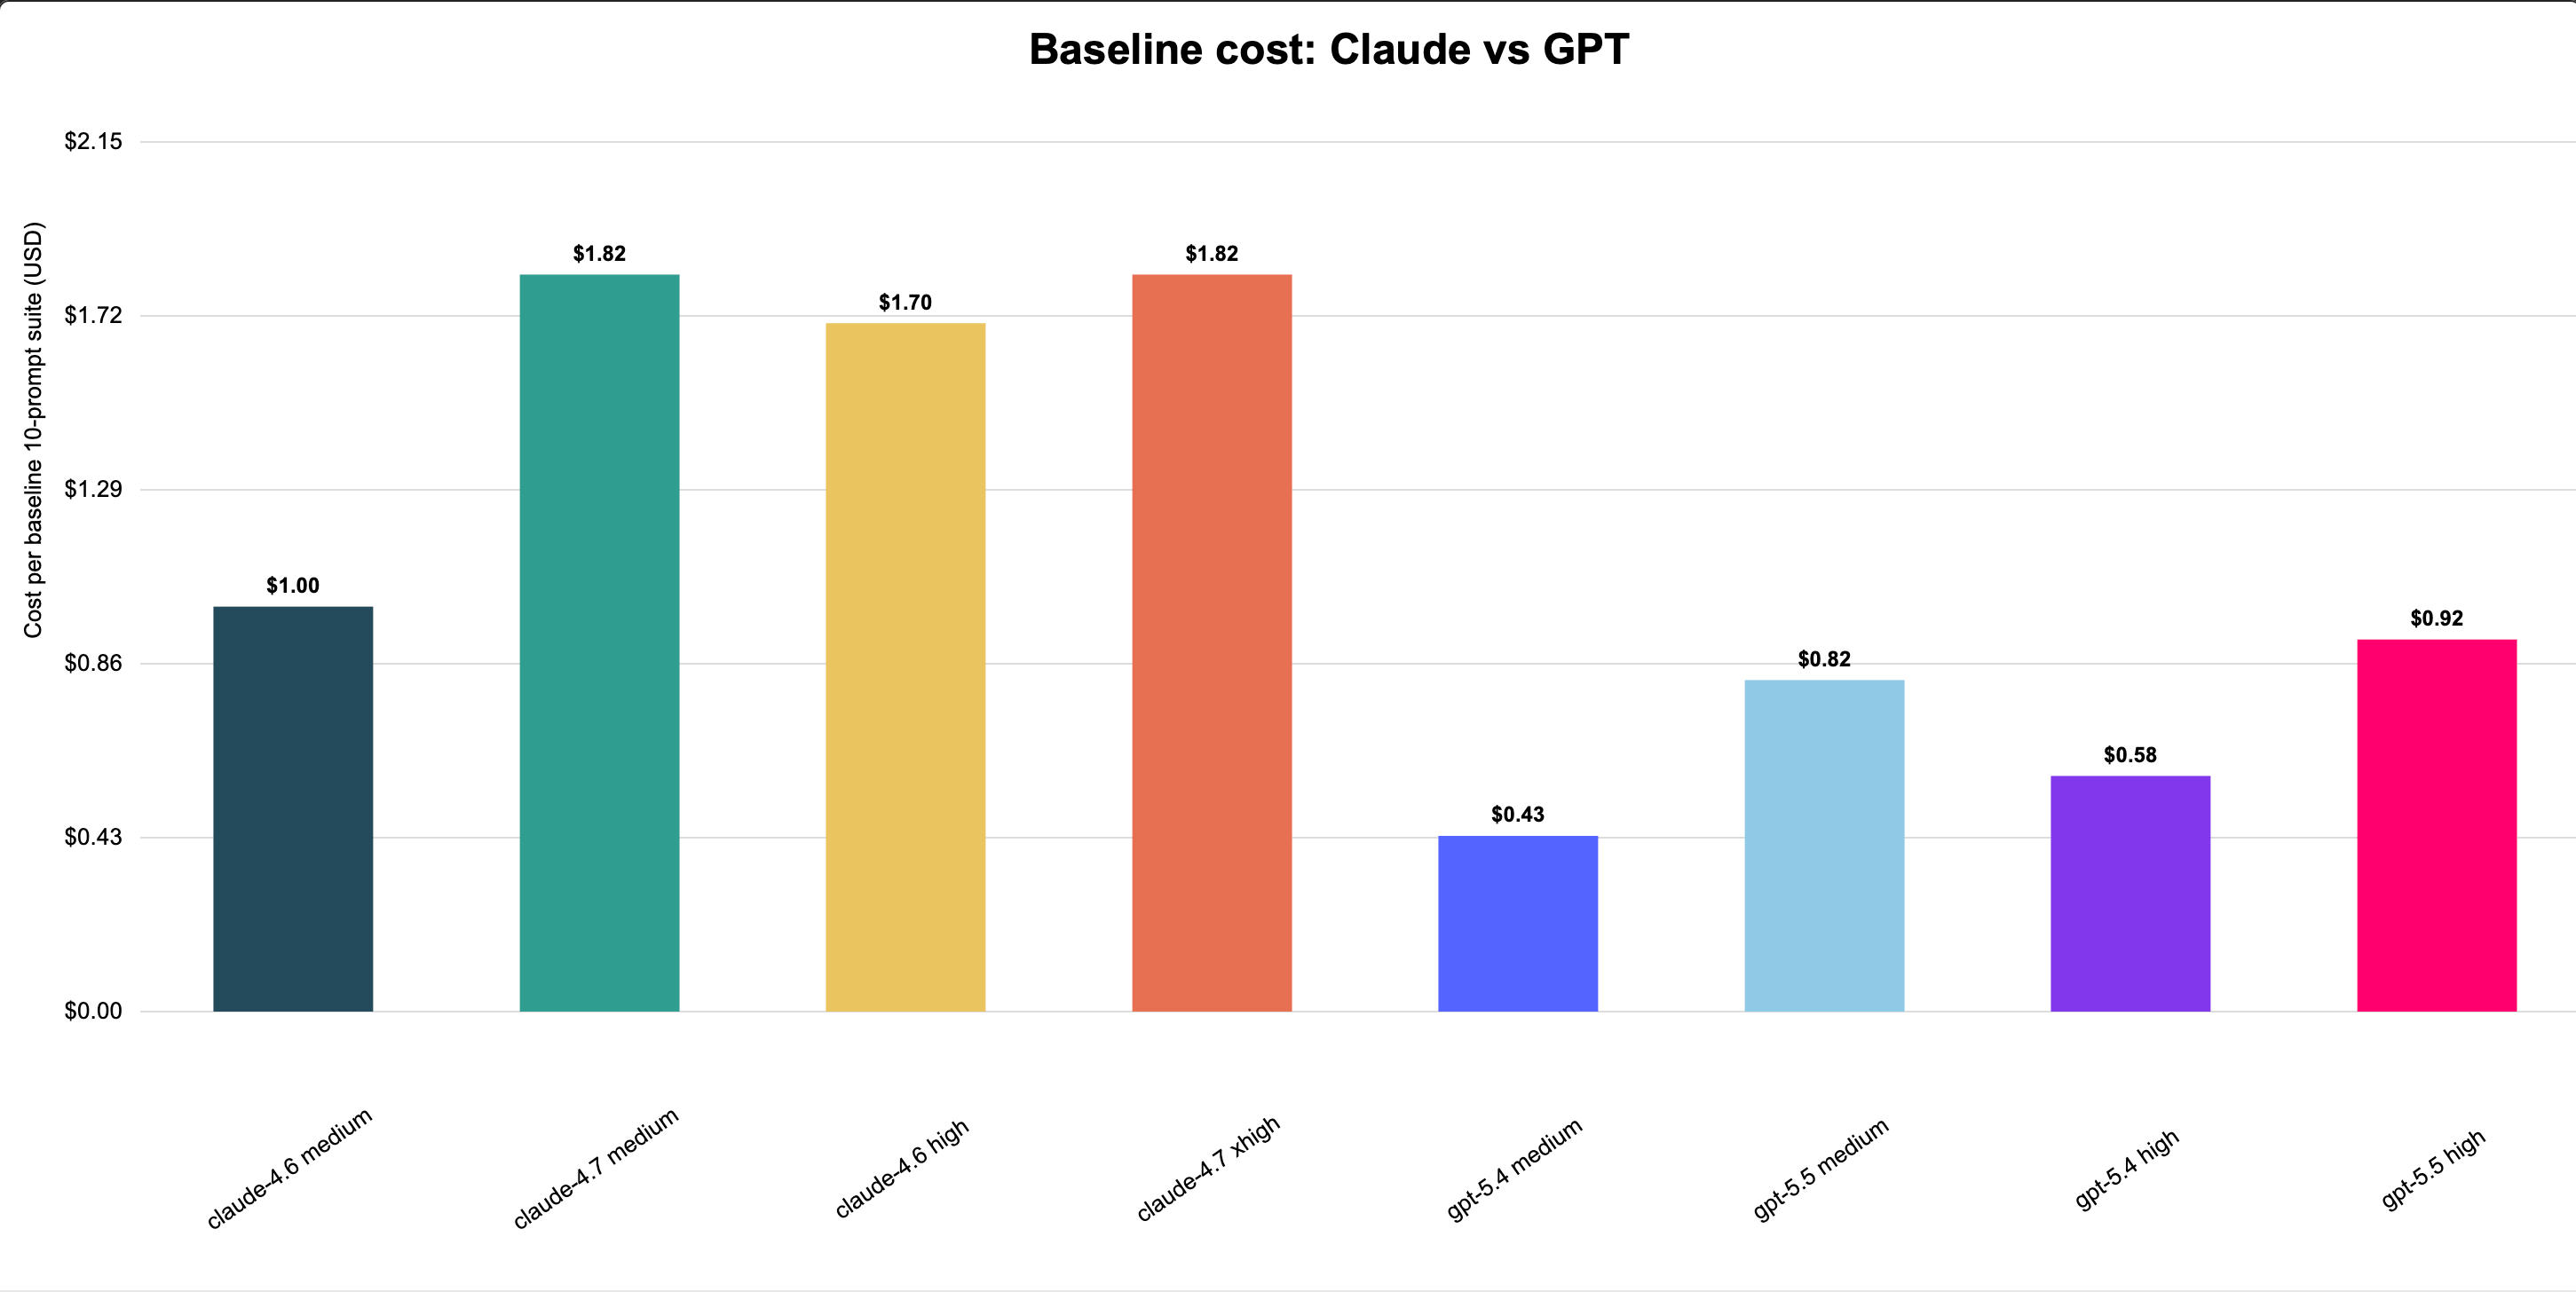
GPT is cheaper across the matched baseline comparisons: gpt-5.4 medium/high is far below Claude 4.6 medium/high, and gpt-5.5 medium/high is also below Claude 4.7 medium/xhigh. Within GPT, gpt-5.5 costs more than gpt-5.4, but both remain below the matching Claude baseline costs in this one-off comparison.
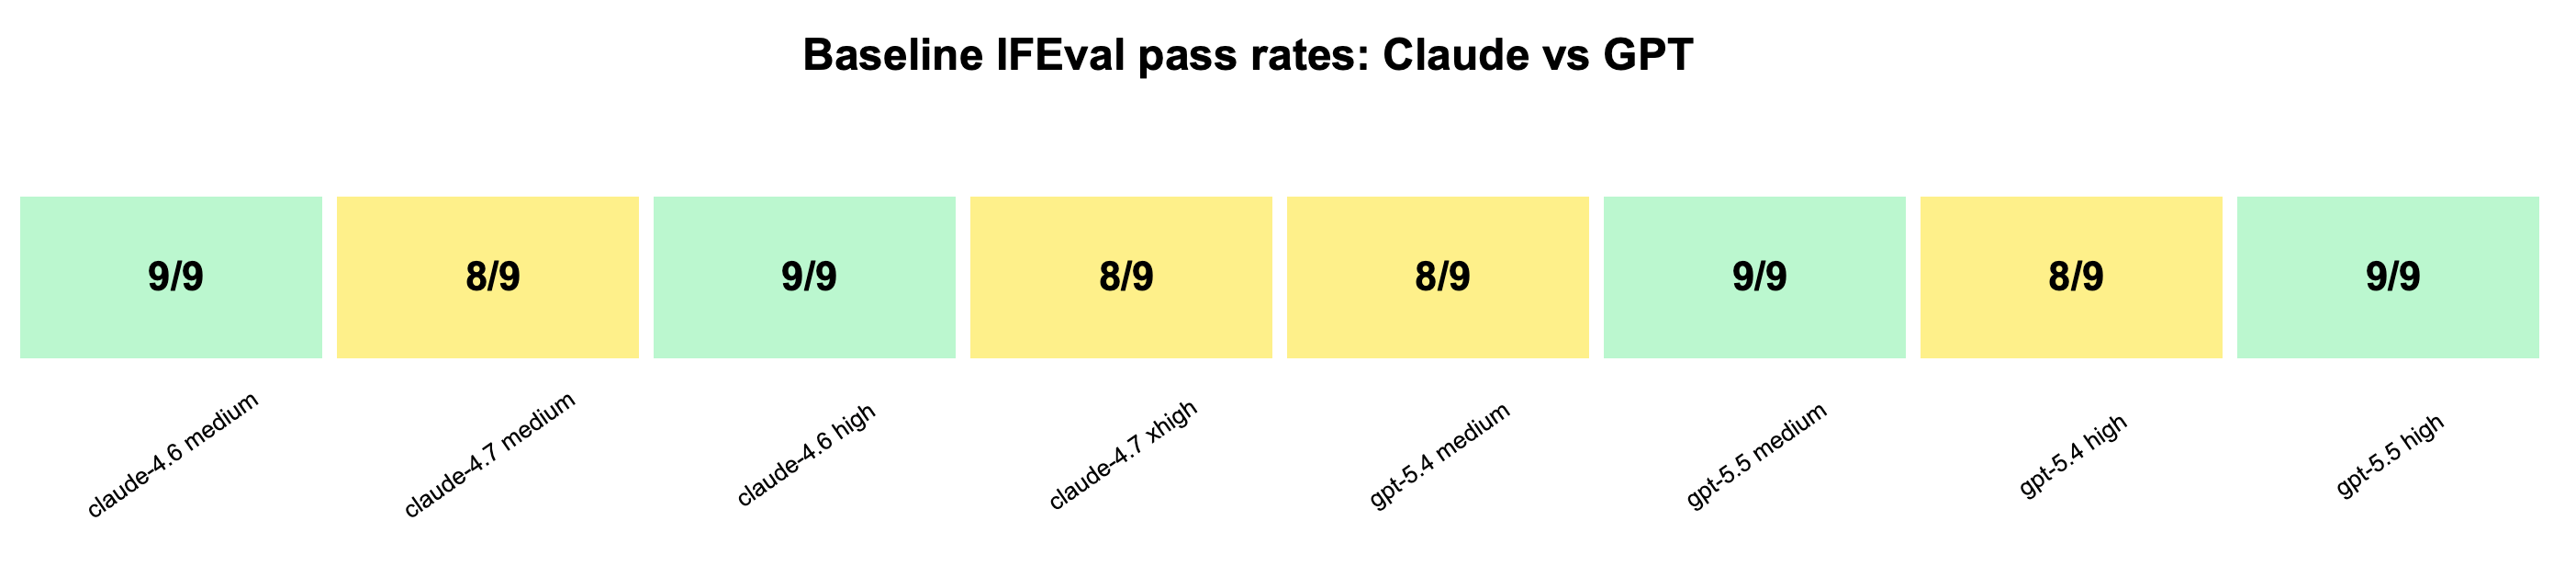
gpt-5.5 is the strongest GPT result, passing 9/9 at both medium and high. gpt-5.4 passes 8/9 at both efforts, trailing Claude 4.6’s 9/9 but matching or exceeding the provided Claude 4.7 baseline 8/9.
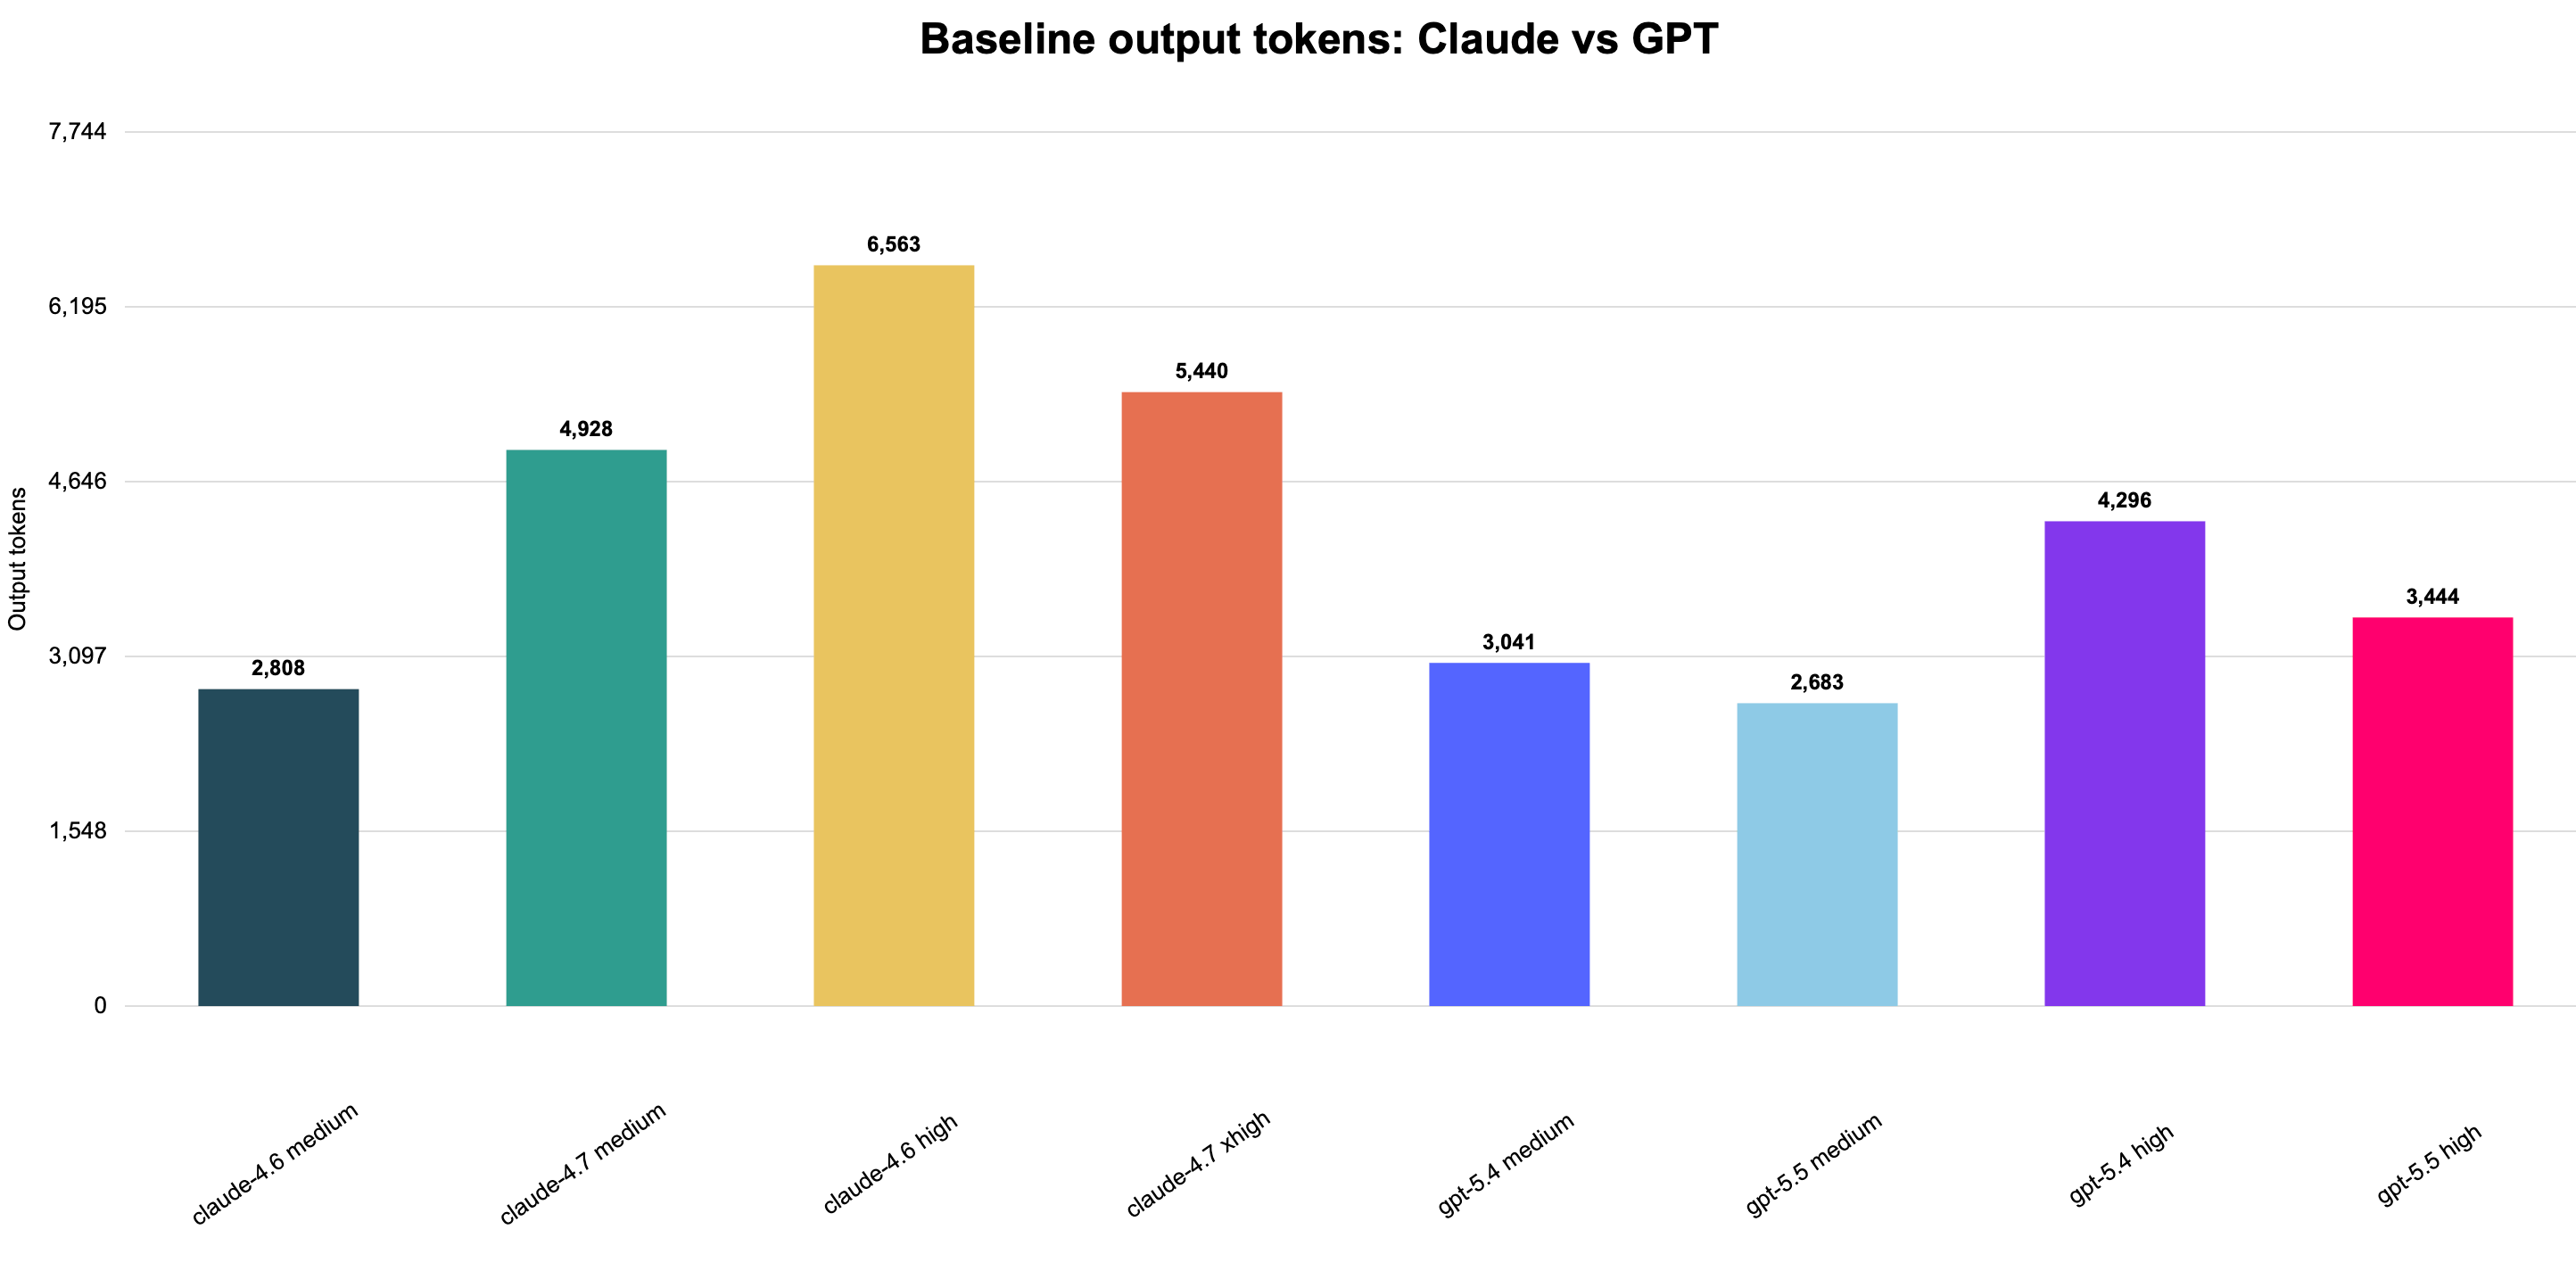
Claude emits more output in the high-effort rows, especially Claude 4.6 high. GPT is more compact overall, with gpt-5.5 medium producing the fewest output tokens among the GPT/Claude baseline set, which helps explain its lower latency and cost despite higher GPT-5.5 pricing than GPT-5.4.
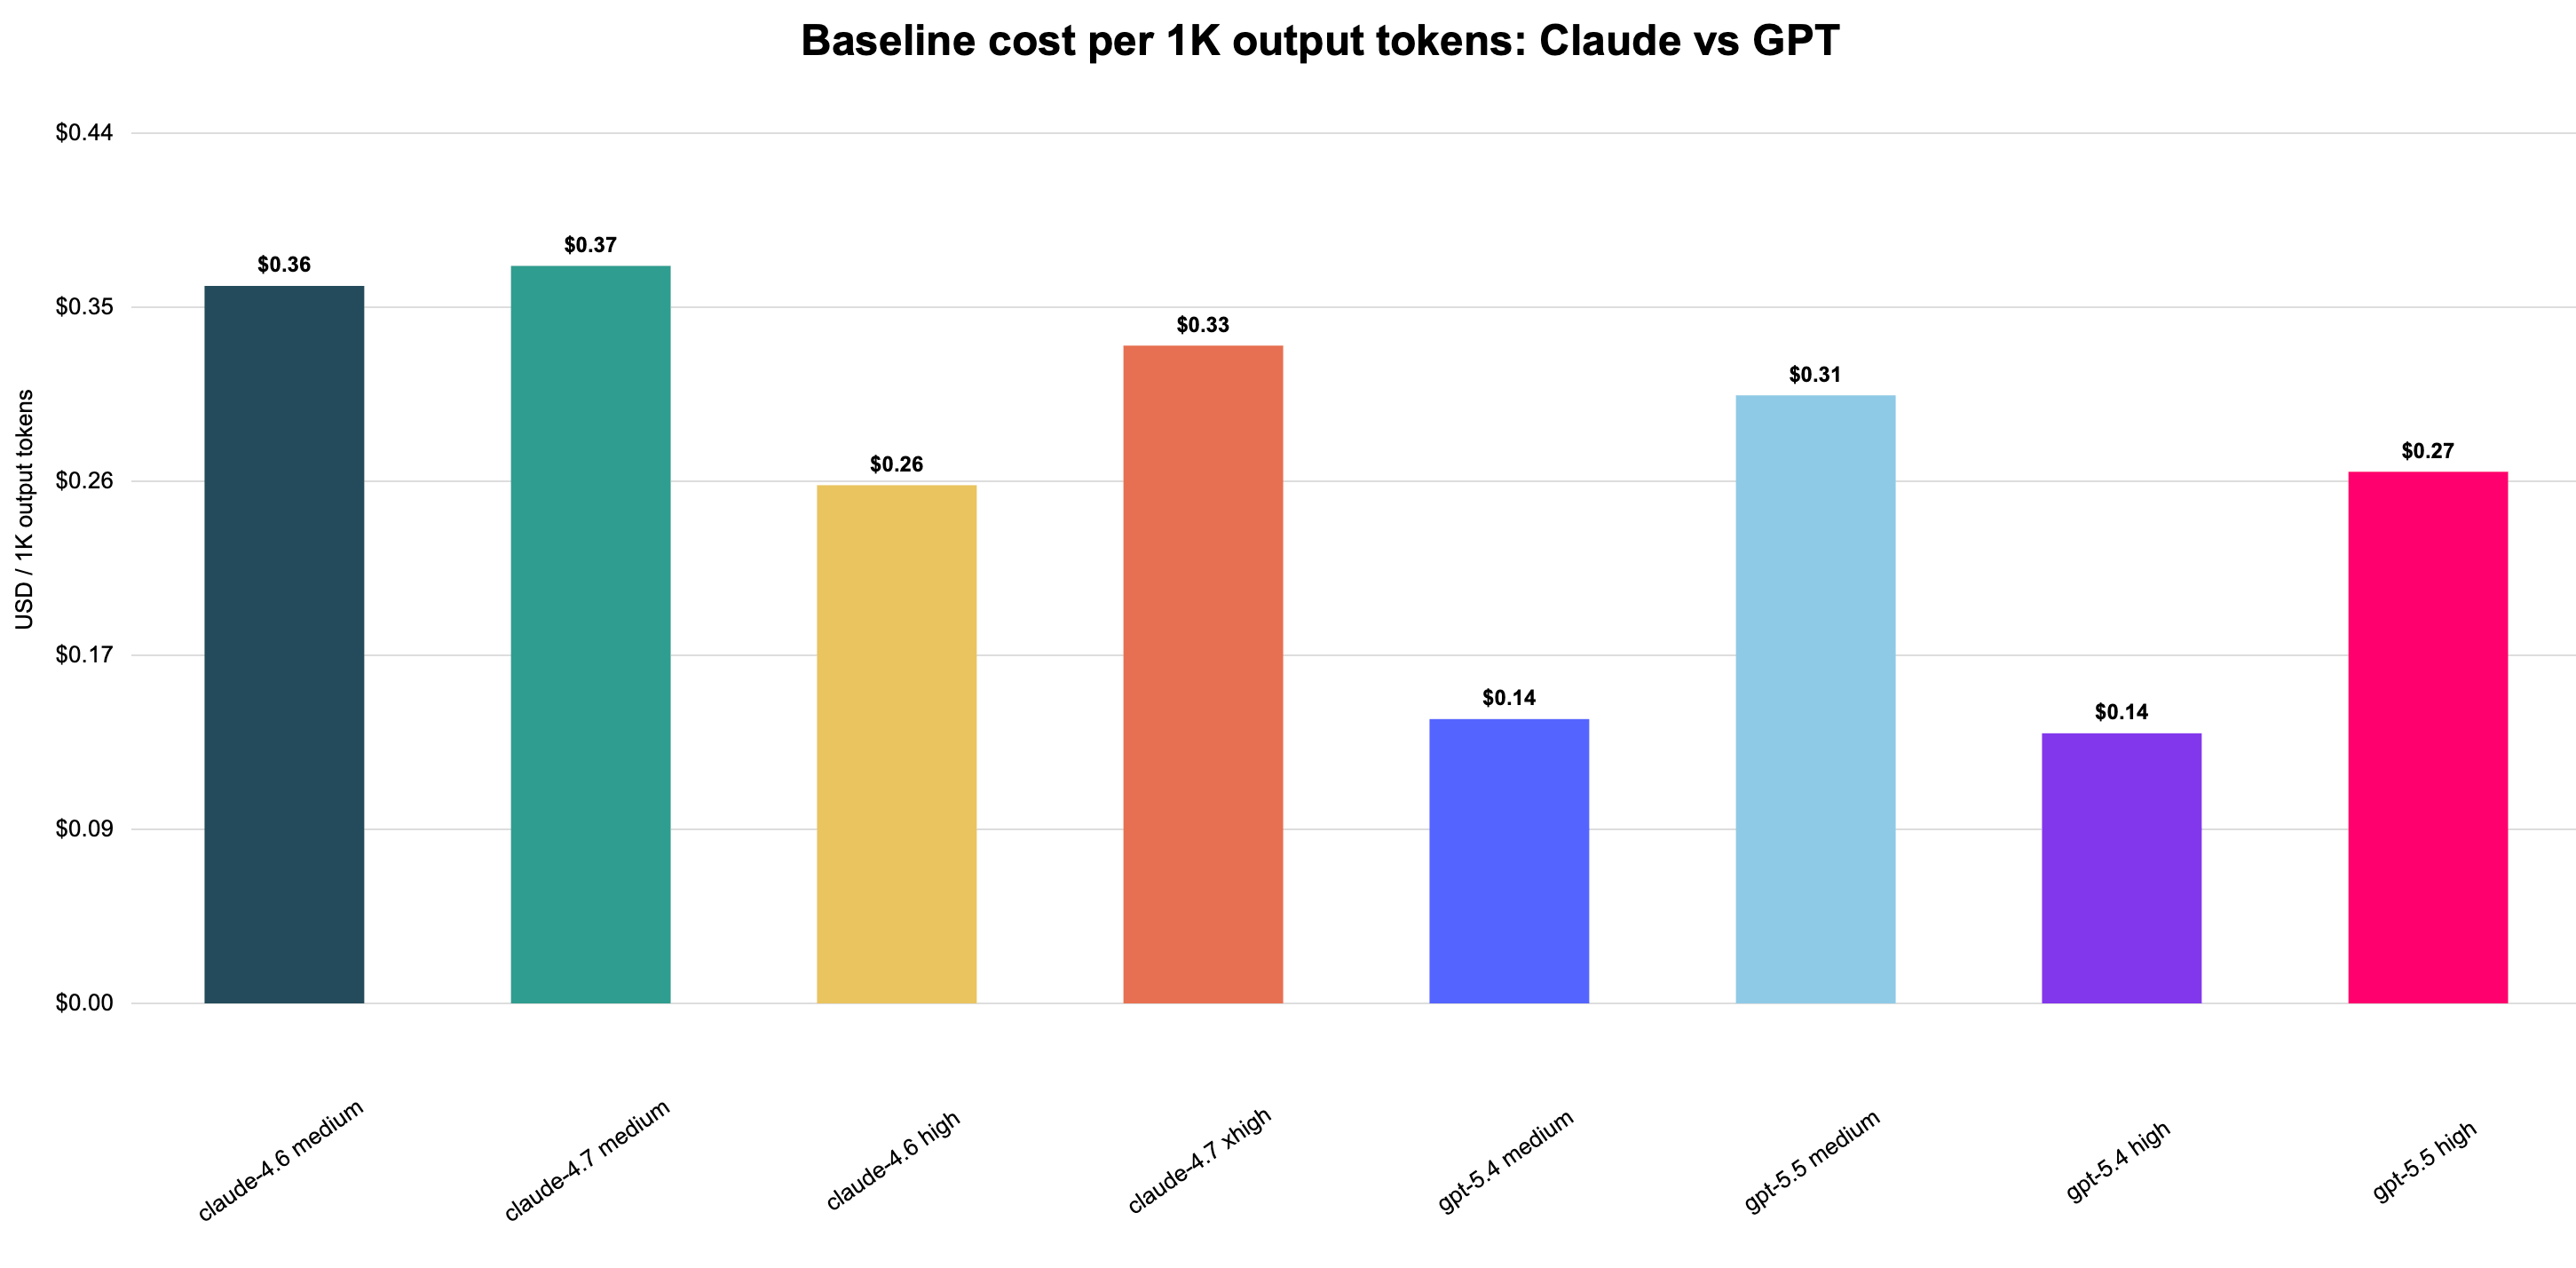
GPT-5.4 has the best cost efficiency per output token in this comparison, especially at high effort. GPT-5.5 is more expensive per output token than GPT-5.4 but remains competitive with Claude 4.7; Claude 4.7 medium and xhigh are among the higher cost-per-output cells.
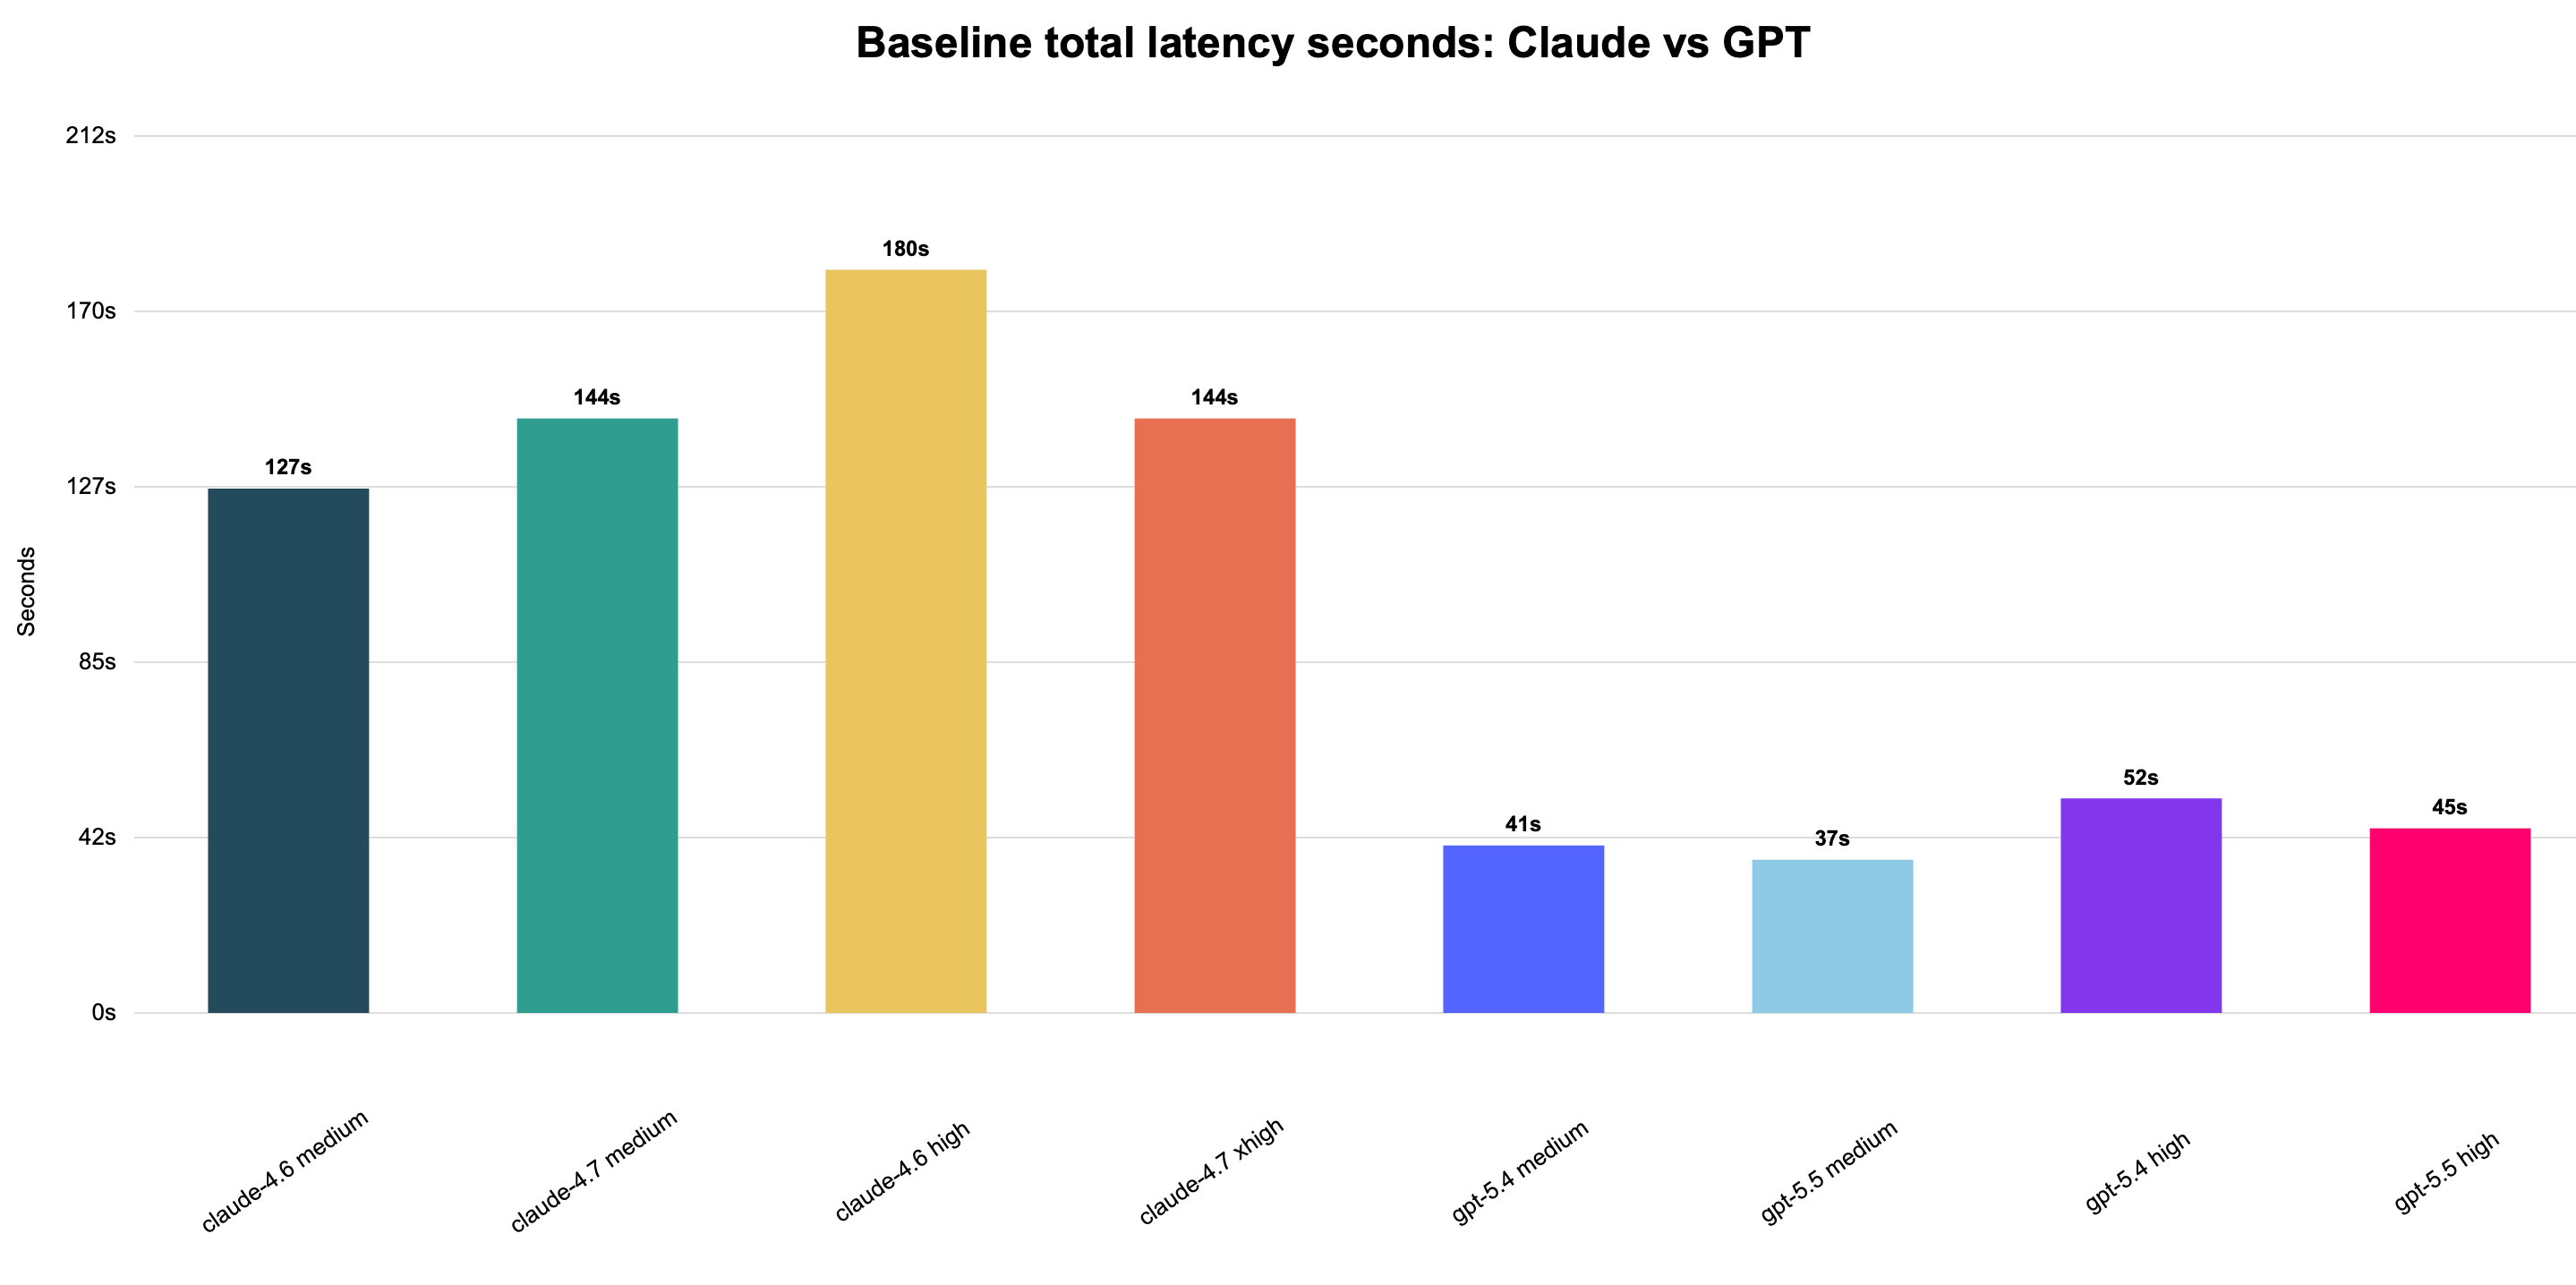
GPT is much faster in this run, with total baseline latency around 37-52s compared with Claude’s 127-180s. The GPT high-effort cells are slower than GPT medium, as expected, but still substantially faster than the Claude baseline chart labels.
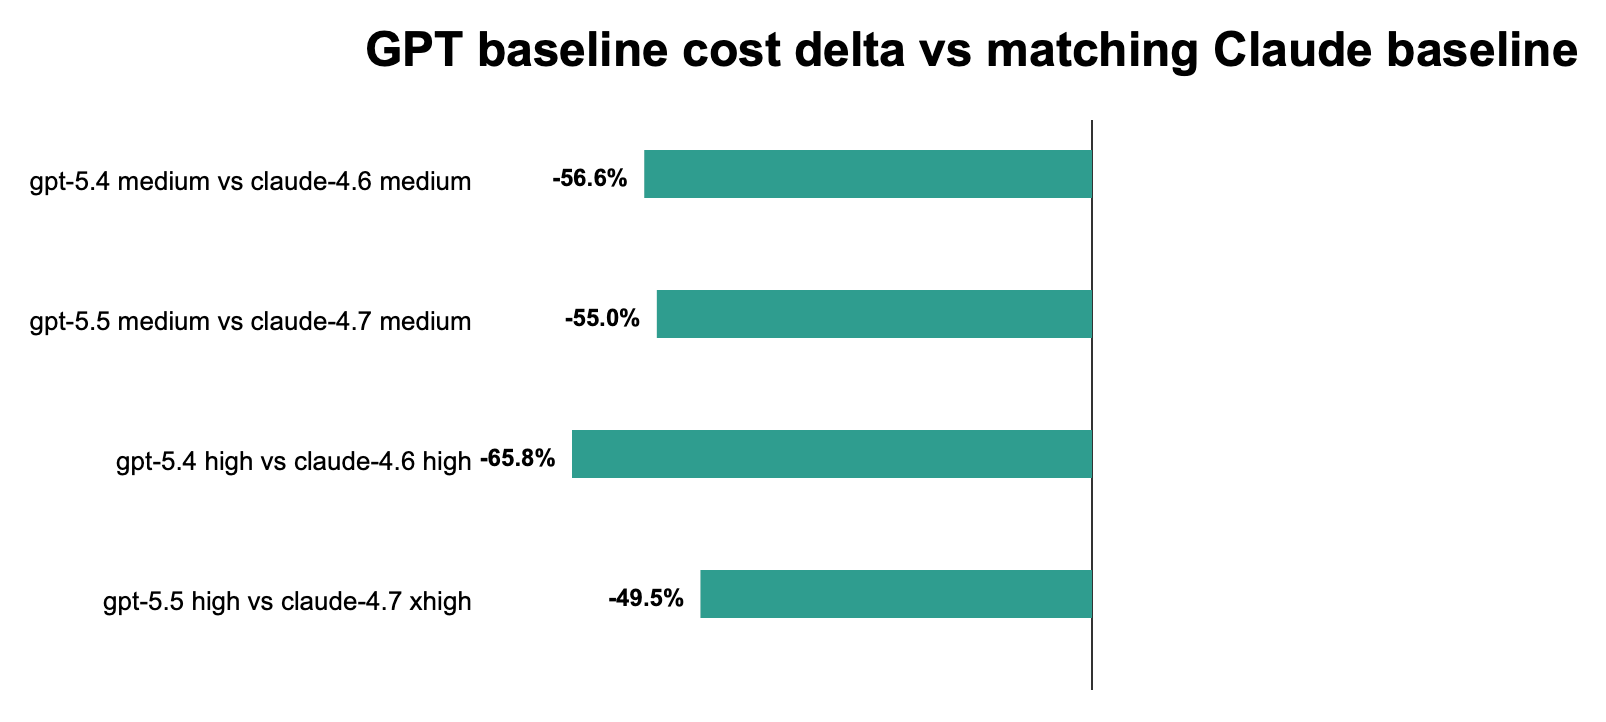
The delta chart shows GPT costs below the matching Claude baselines in all four pairings. The biggest relative savings are against Claude high/xhigh cells, while gpt-5.5 narrows the savings gap because it costs more than gpt-5.4 while still staying below the matched Claude baseline.
What’s next
The next experiment is applying these findings to real Claude Code workflows. The hypothesis is that no-tools will be useful for a subset (prose drafting, direct Q&A, inline code generation) and harmful for another (repository inspection, debugging with tool reads). Mapping that boundary with actual tasks – and tracking which prompts break IFEval-style constraints along the way – is more useful than the aggregate cost numbers alone.
The benchmark tooling should also surface per-prompt cost spikes as a default view. Session totals are misleading when one prompt is doing most of the damage. A view that ranks prompts by cost within a session – and flags which steering variant concentrated the most spend in a single turn – would have made the instruction_stress and code_review findings immediately obvious, without needing to parse the raw turn data to find them.
If you’re interested in practical AI building for web apps, developer workflows, and infrastructure, subscribe for future posts. You can also follow my shorter updates on Threads (@george_sl_liu) and Bluesky (@georgesl.bsky.social) or subscribe and follow along.
Appreciate the detailed research! Super interesting to see, with data, how behavior changes with instruction changes. Going to try asking my agent to be more concise and see what changes.
You mentioned at the end that your next experiment is applying these findings to real Claude Code workflows - I actually just ran something adjacent on 29 real PRs from an open source repo (varying reasoning effort on Opus 4.7).
To do this, I've built a tool to run these kinds of evals on real tasks from your own repo. If you're interested in trying it out to run your next experiment, let me know, I'd love to collaborate. It's clear you've thought about the problem a lot and have your own methodology/thoughts on evals and I'm always looking for informed feedback. Let me know! Either way, keep up the good work