
I Ran Two Claude Opus 4.7 5hr Sessions In One Day
$100.76 across 763 turns at 98.3% cache hit, and didn't hit any 5-hour limits

In this post:
Why I’m writing this
The Claude Code rate-limit complaints have not stopped. Threads, Reddit, GitHub, Hacker News. People say their 5-hour blocks burn out in minutes. Anthropic acknowledged some of it and shipped fixes. The complaints are still loud. Update: the session-metric skill is now publicly available via my Claude Code plugin marketplace.
I’m using Claude Max $100 plan and not in that camp. On 2026-04-17 I used both of my 5-hour blocks in the same day, both on Claude Opus 4.7 with the 1M context window, both inside Claude Code desktop app for MacOS. The blocks were not continuous - block 1 ran through the afternoon, I took a break, block 2 ran through the evening. 7 actual Claude Code sessions, 763 assistant turns, 41 user prompts, $100.76. Cache hit ratio: 98.3%. I did not hit a session limit. I did not hit a weekly limit. The day ended at 14% of my Max (5x) all-models weekly budget.
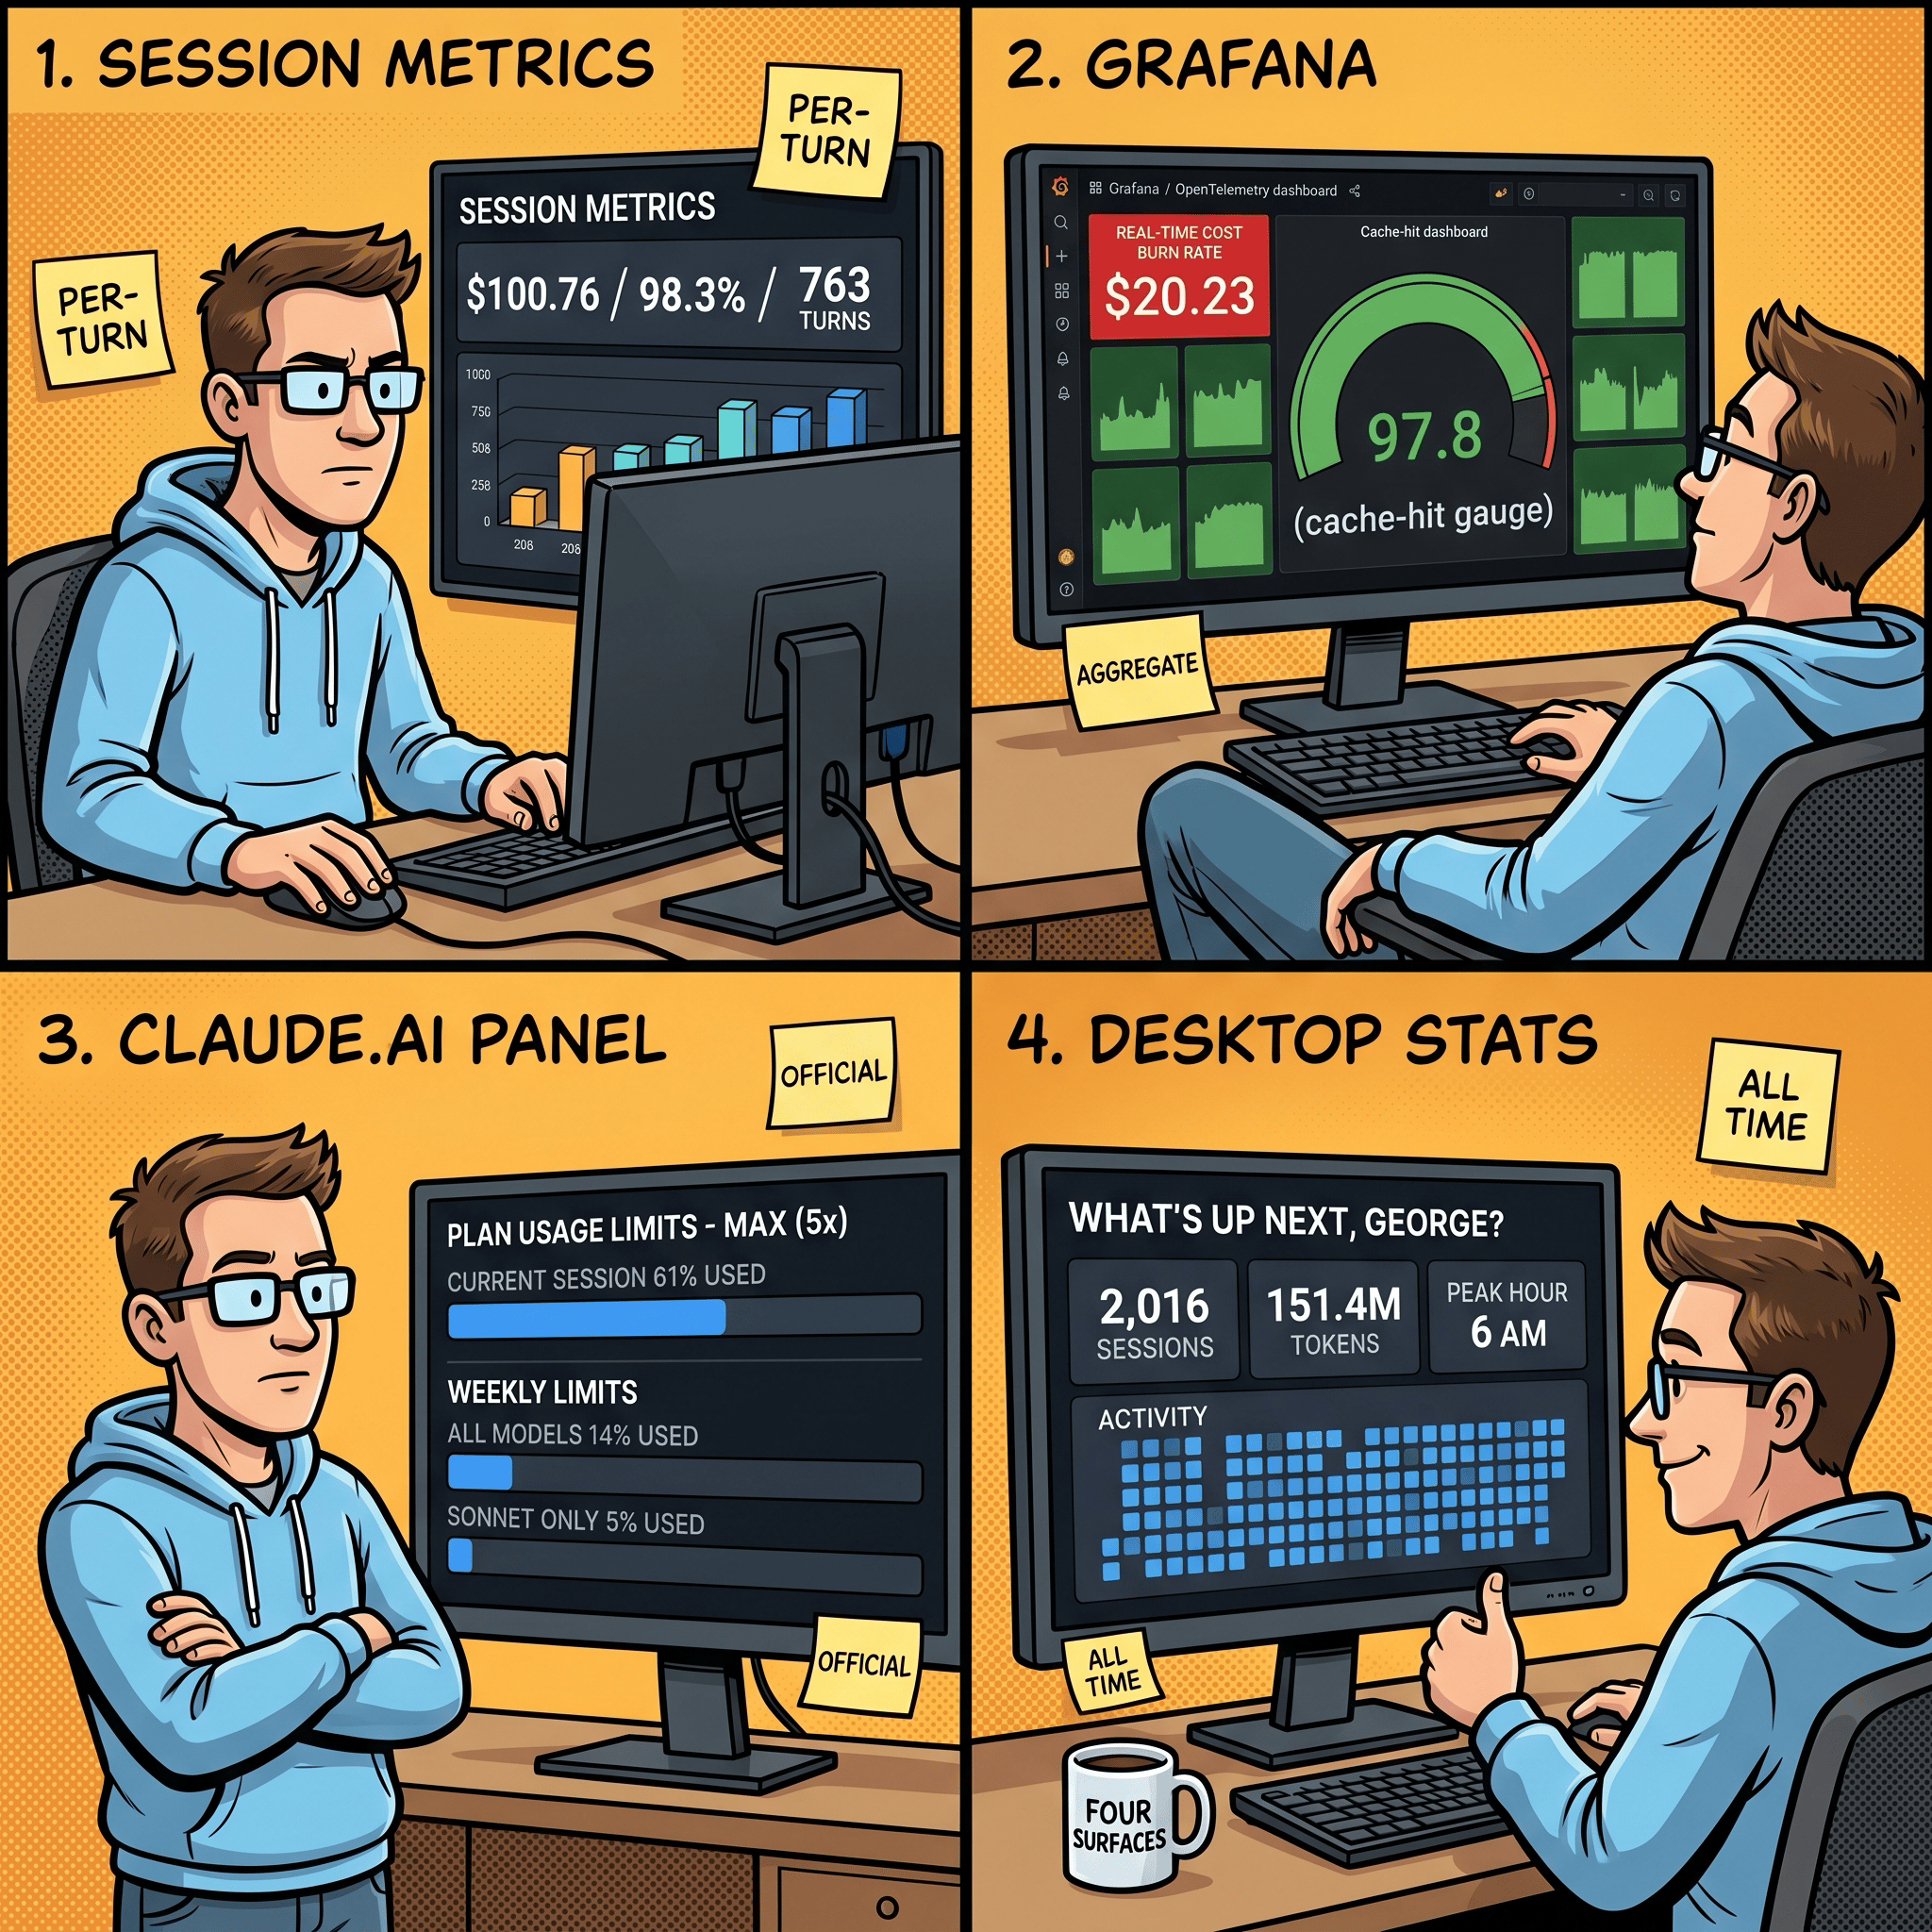
This post is not “I figured out a secret”. It’s the opposite. I instrumented my own usage across four different surfaces so I could see exactly what each block cost me, where the cache held up, and which model picked up which turn. Then I cross-checked the same day against the official Claude.ai usage panel and the new Claude Code desktop stats panel.

Companion piece: I built the sessions-metric skill inspection tool itself in three earlier sessions. That story is in I Built a Token Cost Analyzer for Claude Code. Here’s What I Found. The post you’re reading uses the tool on a real day, plus the three other surfaces.
The two blocks at a glance
Anthropic’s “5-hour session block” is a rolling rate-limit window, not a single Claude Code session. A block opens with your first prompt and closes 5 hours after that anchor, regardless of how many actual claude invocations you started in between. On a Max (5x) plan you get a finite number of these blocks per week. Once a block closes, the next one can open at your next prompt.
Here’s the day, anchored in AEST (UTC+10):
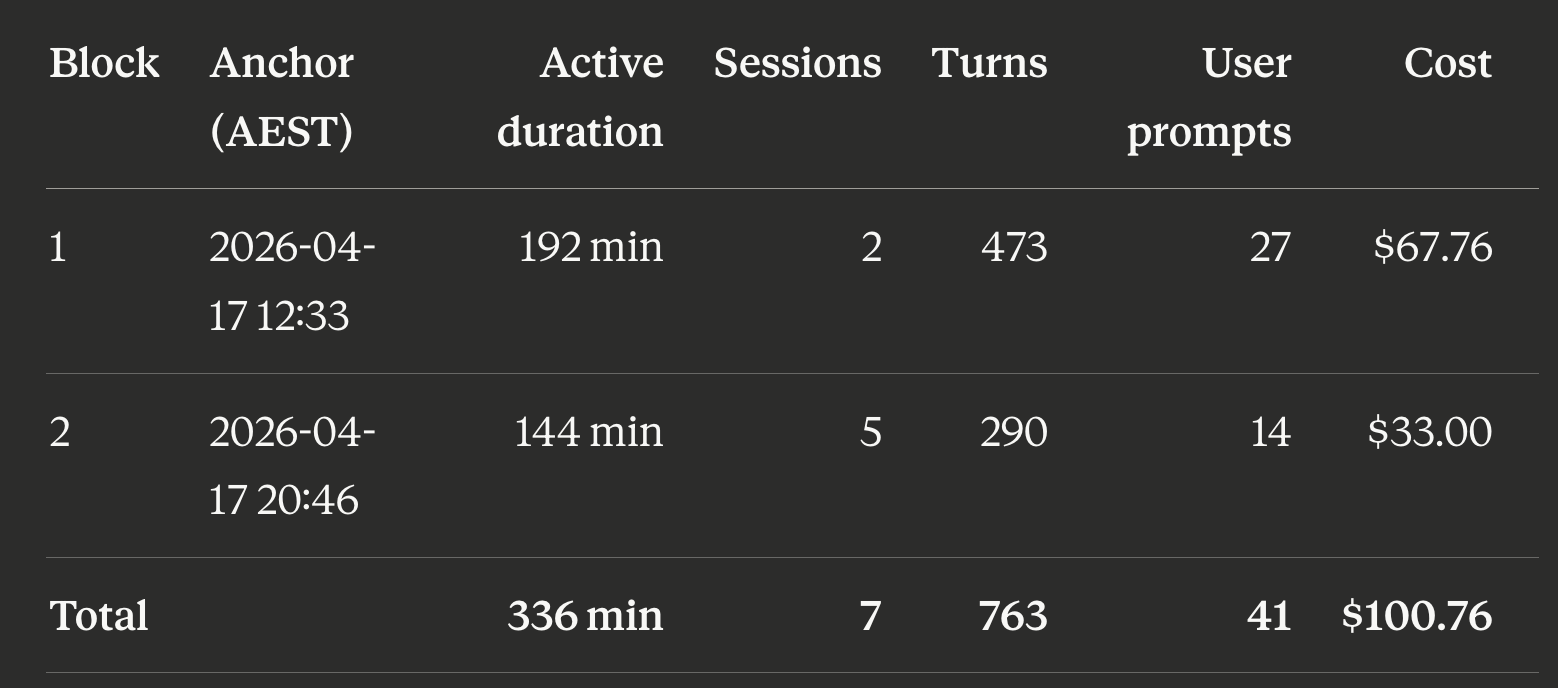
Block 1 ran from 12:33 to roughly 15:45 AEST. Block 2 ran from 20:46 to 23:10. About 5 hours of real-world break sat between them. “Active duration” is wall-clock from the first event in the block to the last, not the 5-hour rate-limit window itself.
763 assistant turns from 41 user prompts is an 18.6:1 ratio. Most of those assistant turns were tool calls (Read, Edit, Bash) inside the same prompt. The model is looping through work, not chatting back at me. That’s exactly what Claude Code is supposed to do.
sessions-metric skill’s HTML output for all sessions for this Claude Code project.
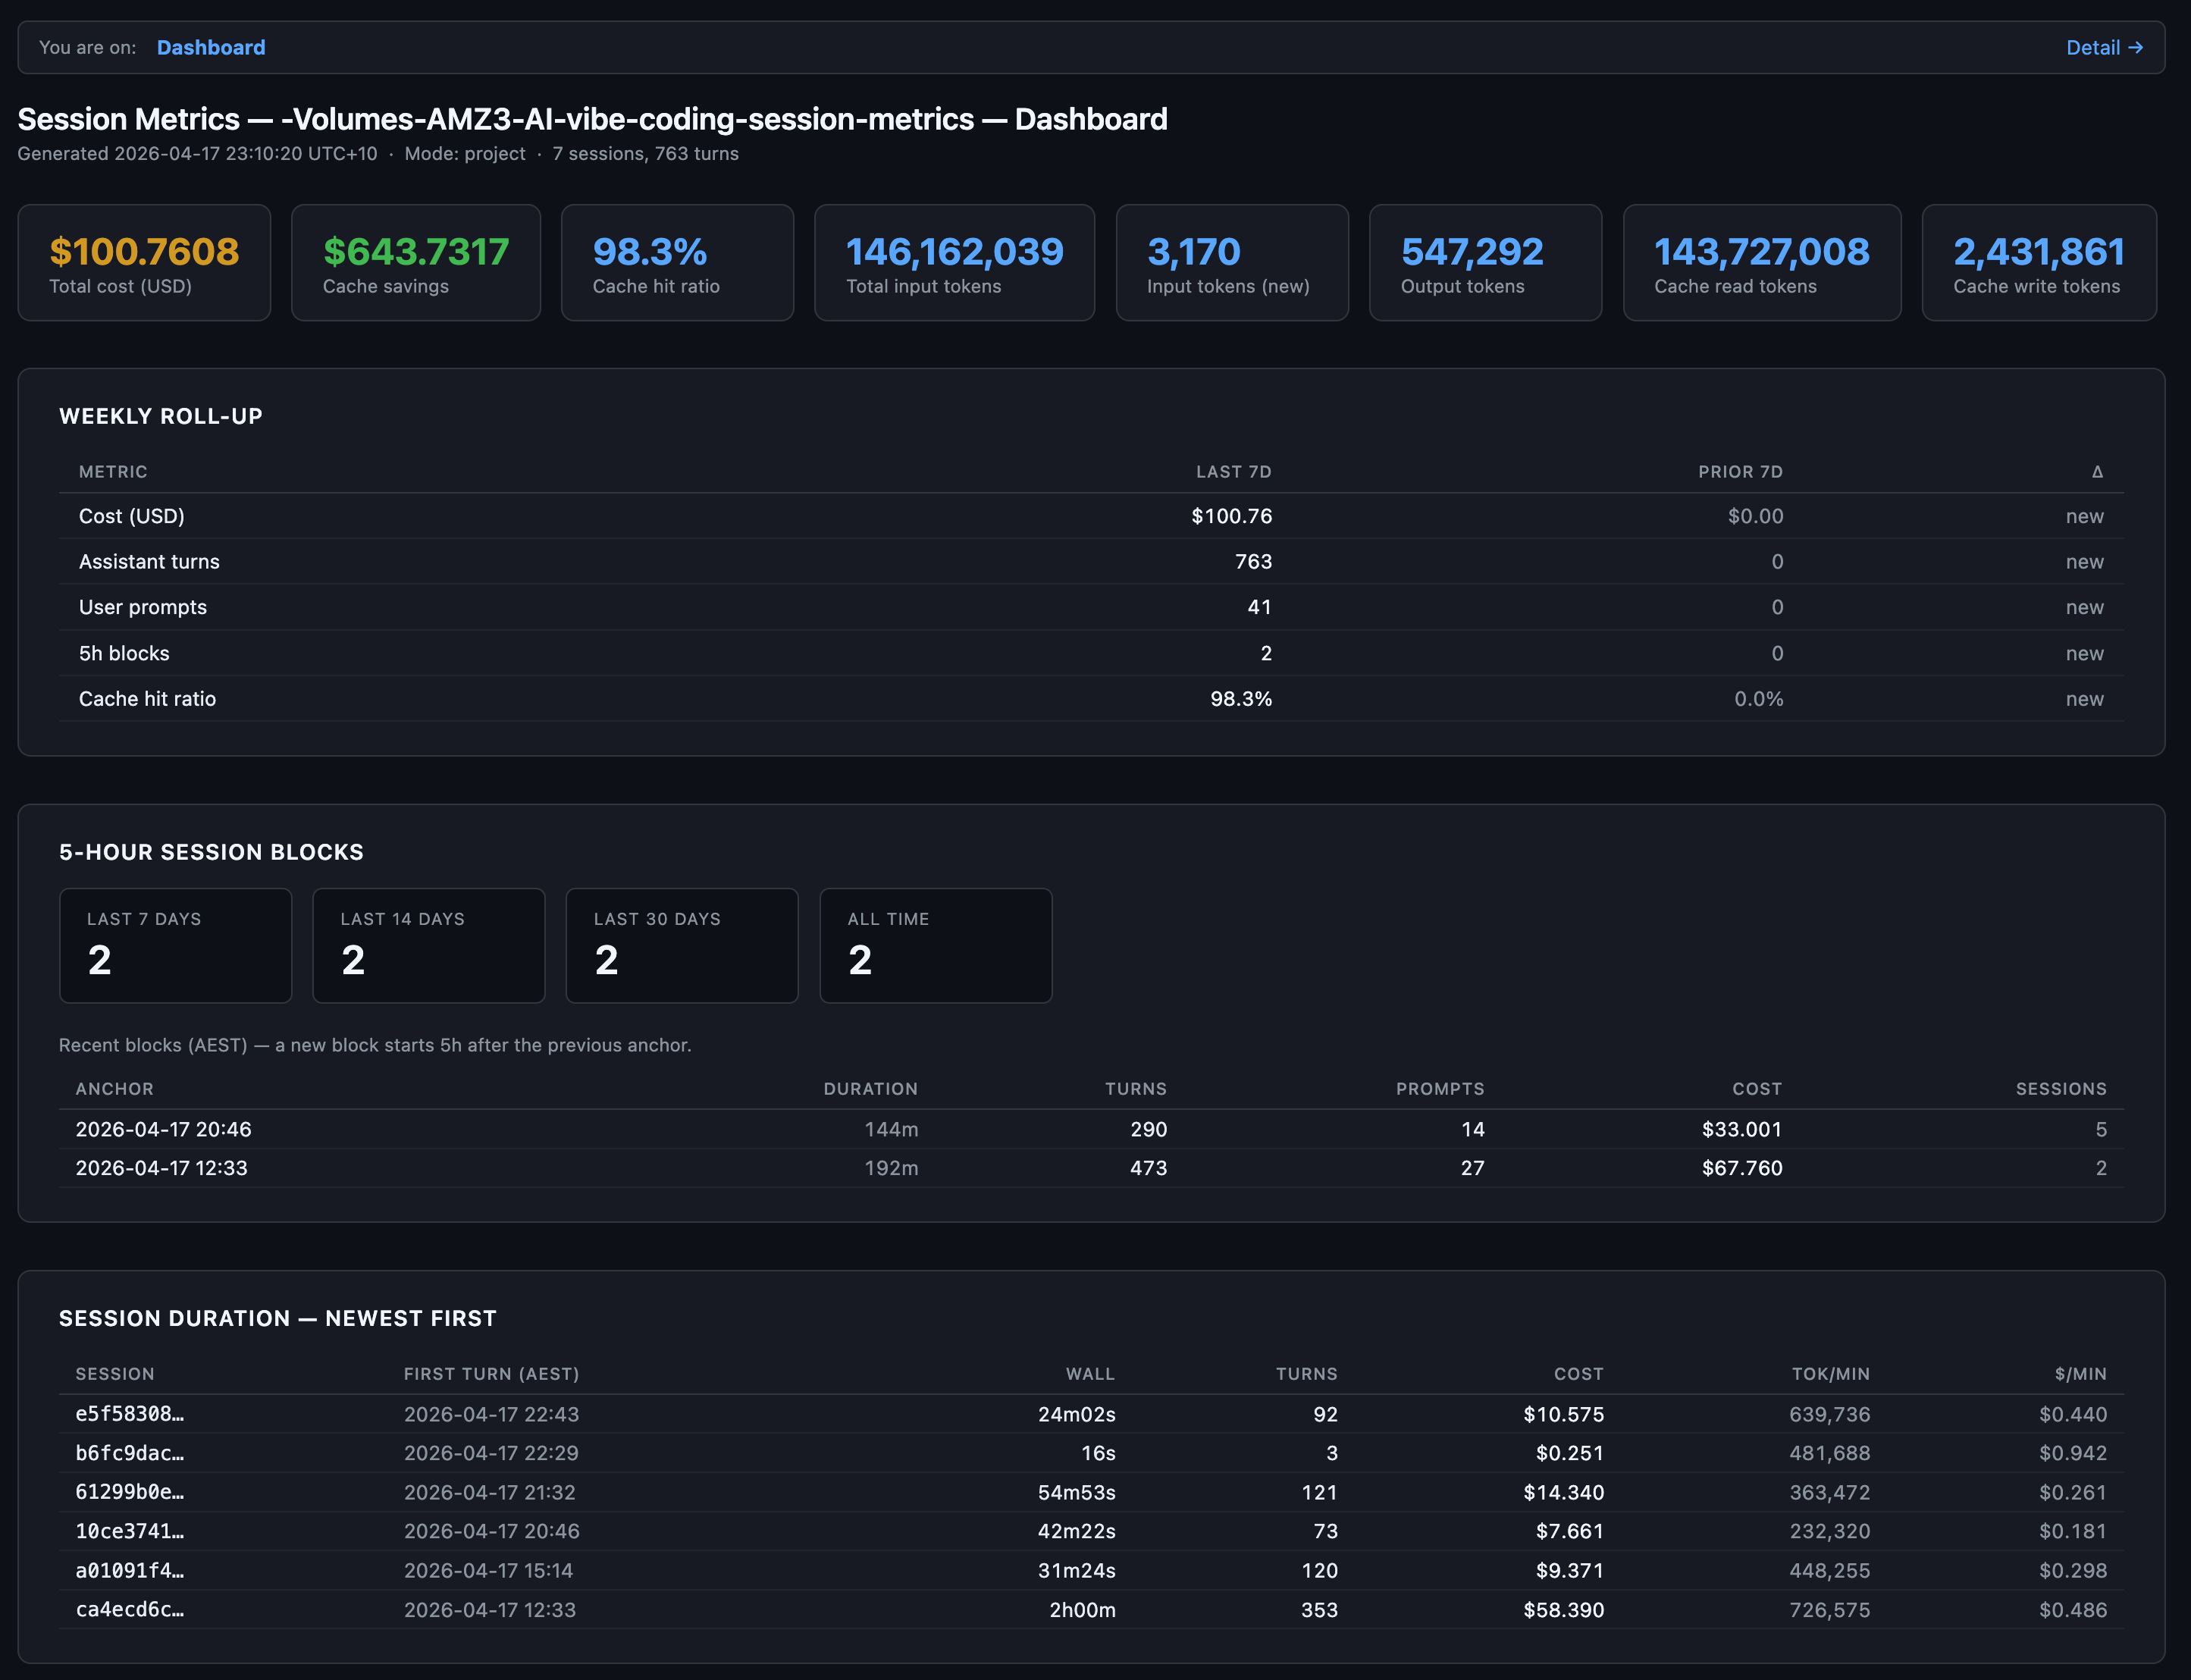
The “$643.7317” stat card is the savings figure. It’s what those same 763 turns would have cost without prompt caching. Cache reads cost 0.1x base input, cache writes cost 1.25x. At a 98.3% hit rate, almost the entire context payload on every turn hit the cache. Without it, this day would have cost about $744. With it, $100.76. That gap is probably the entire reason I’m not in the rate-limit complaint group?
Surface 1: per-turn detail with the session-metrics skill
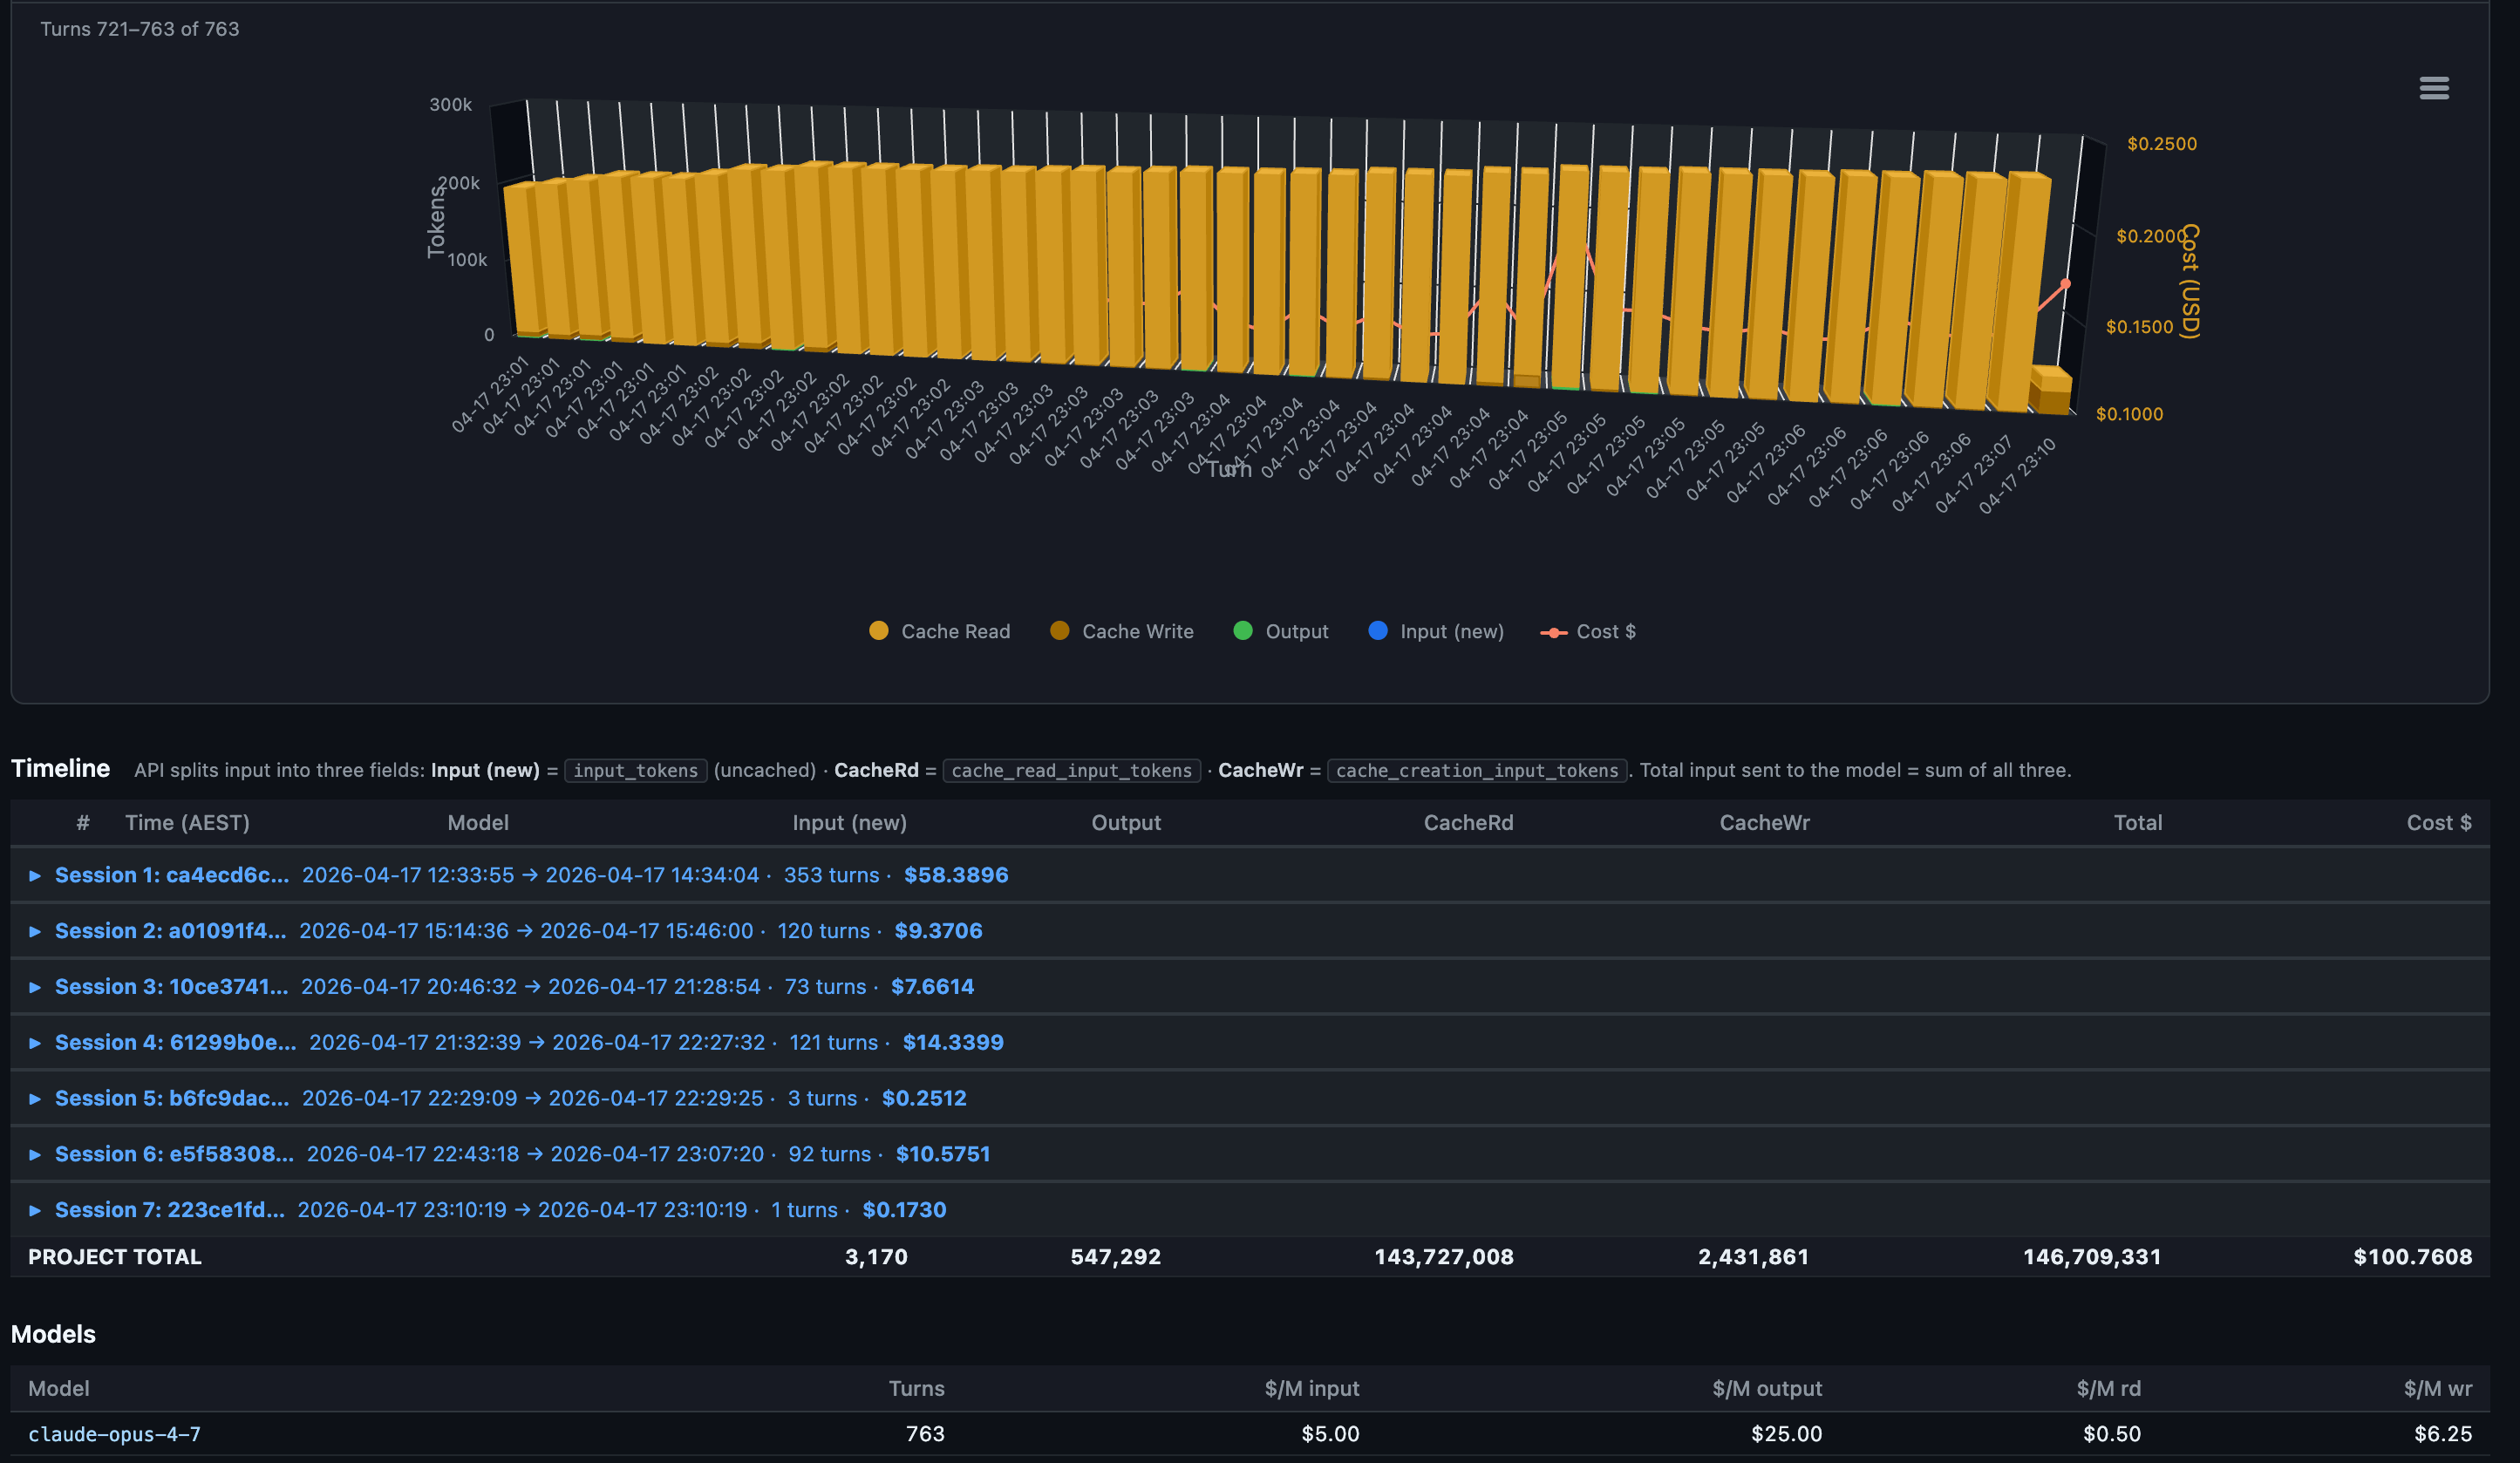
This is the surface I built. It reads Claude Code’s raw JSONL conversation logs from ~/.claude/projects/<slug>/<session-uuid>.jsonl, deduplicates on message.id, and produces a per-turn breakdown with five export formats (text, JSON, CSV, Markdown, HTML). The HTML version splits into a dashboard page and a detail page. The dashboard above is the dashboard half.

The detail page is the part that earns its keep:
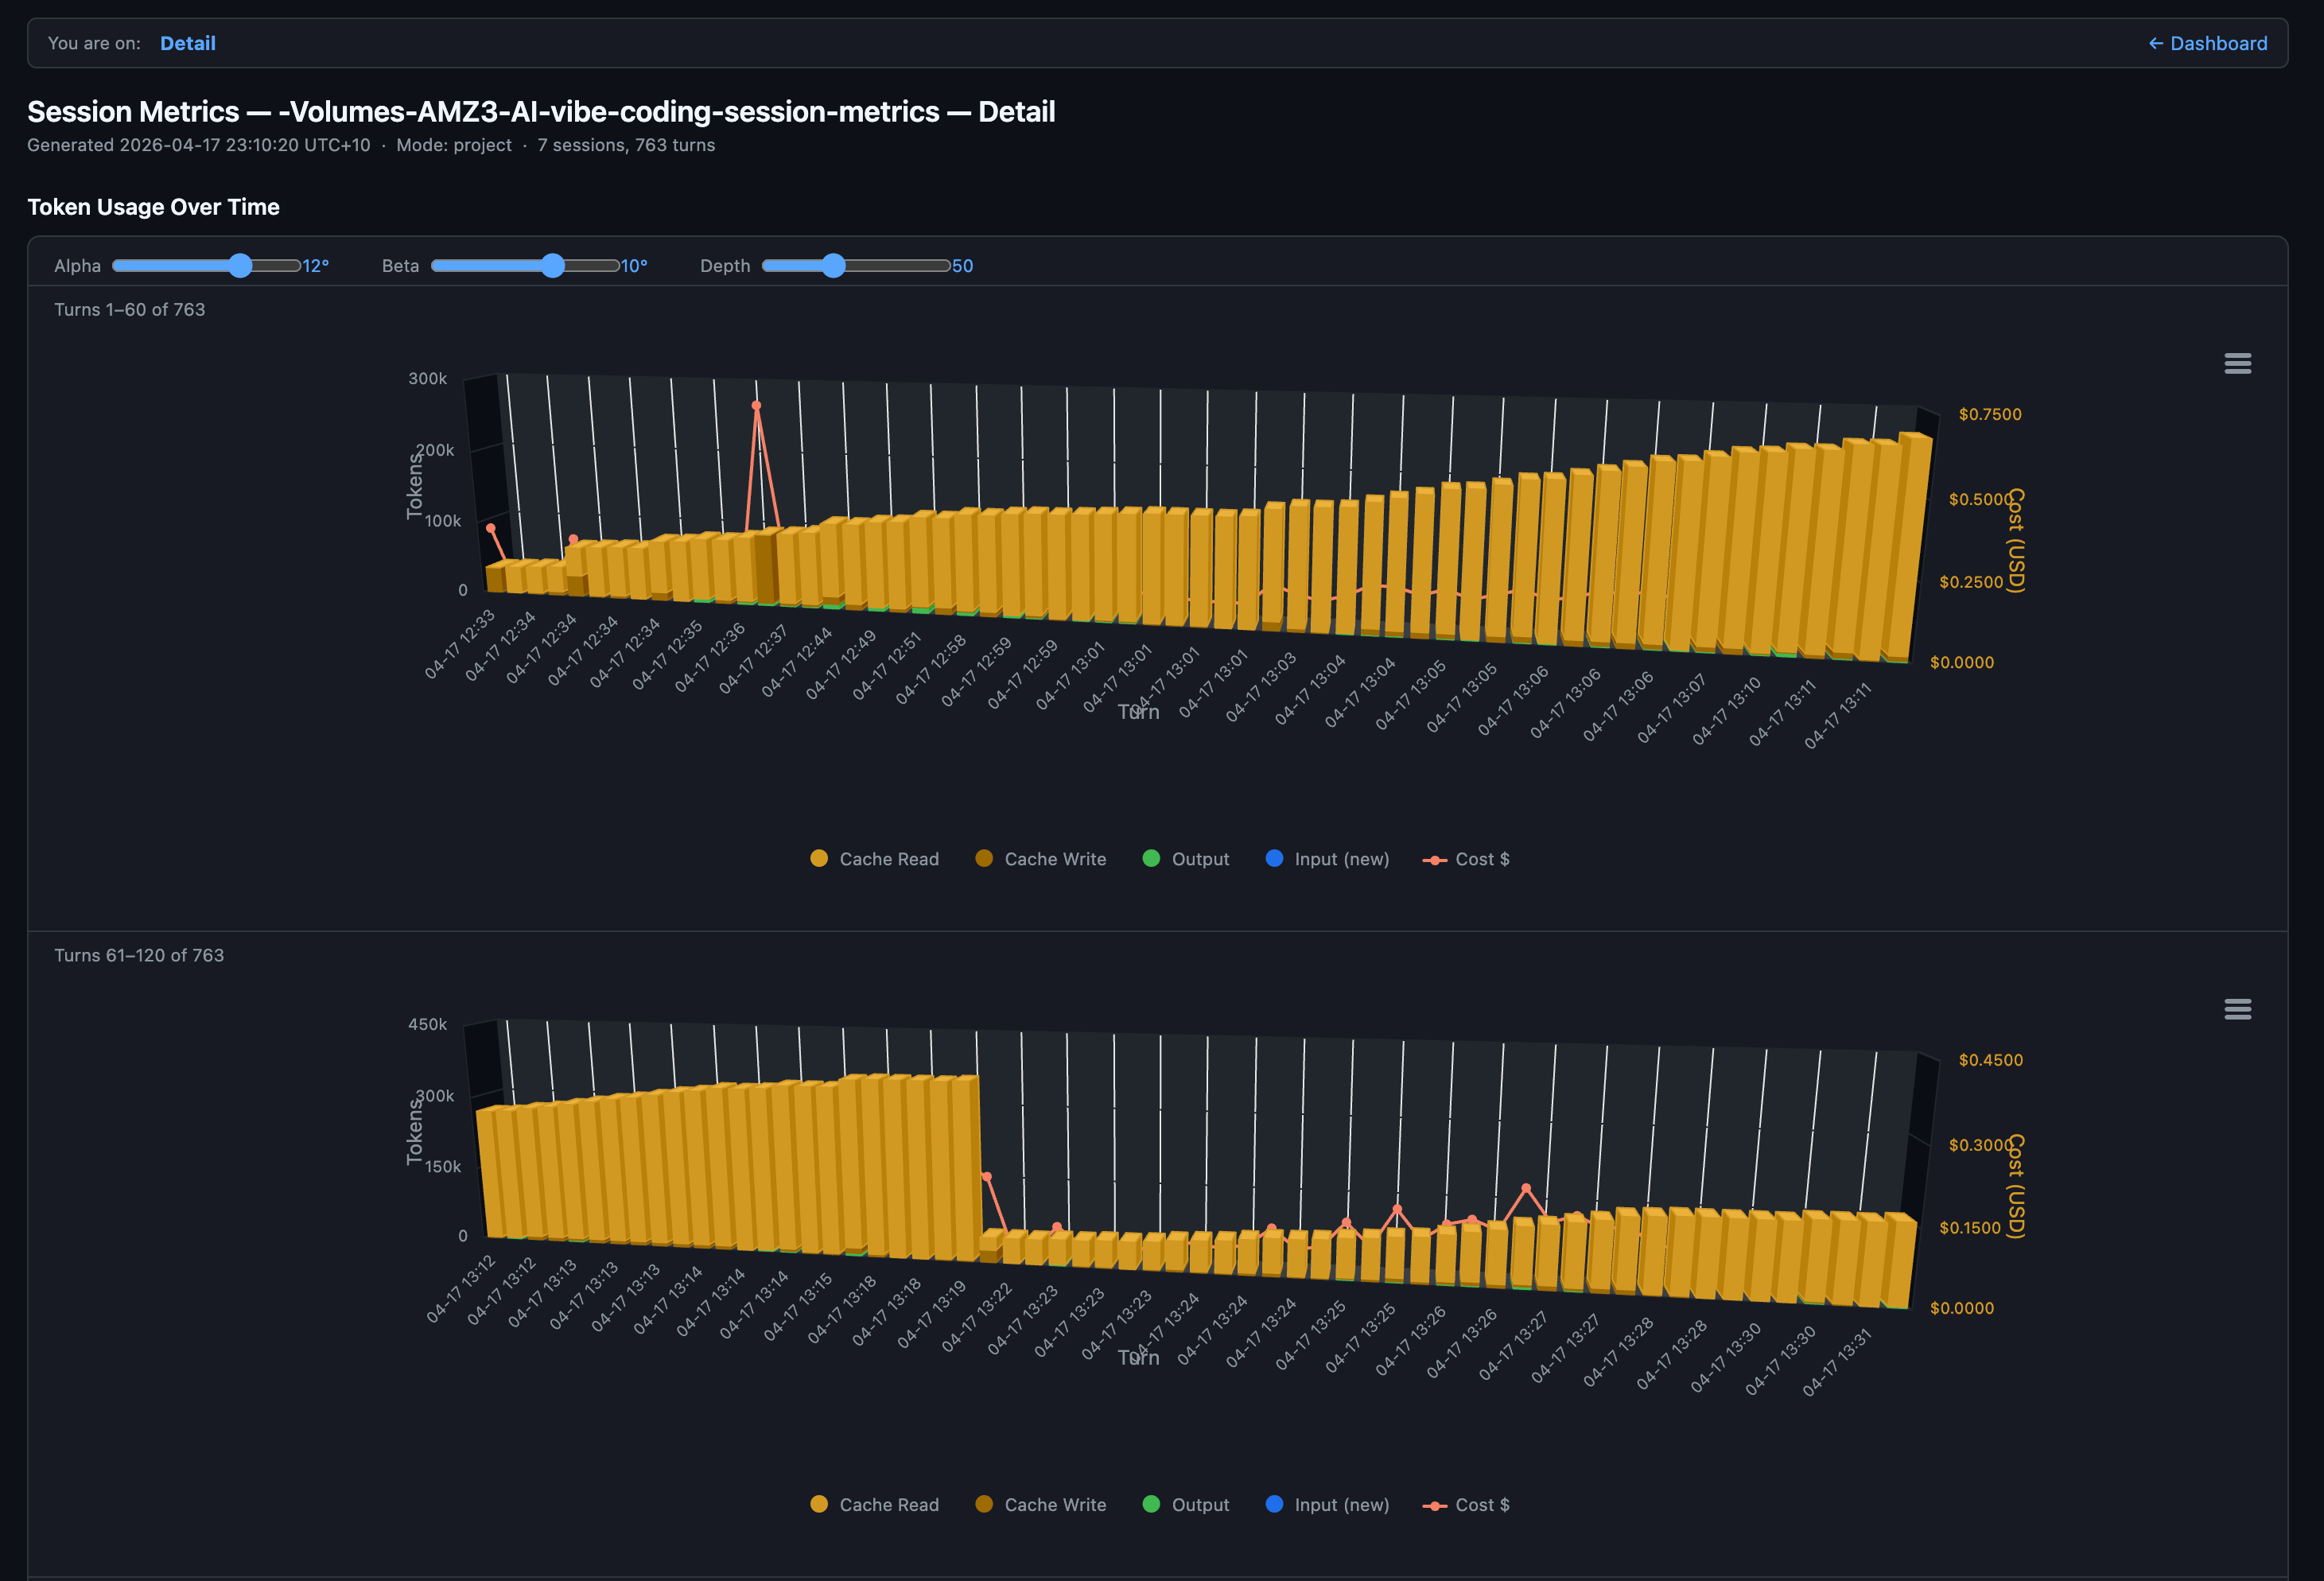
Each column is one turn. Amber dominates because cache reads are the bulk of every turn’s input. The brief orange spike near turn 40 is a cache write where the conversation prefix grew enough to re-cache. The red line is the per-turn cost, riding the secondary y-axis. You can see the model paying steady $0.20 to $0.30 per turn for most of session 1 with occasional spikes when a turn does heavy planning or reads a large file.
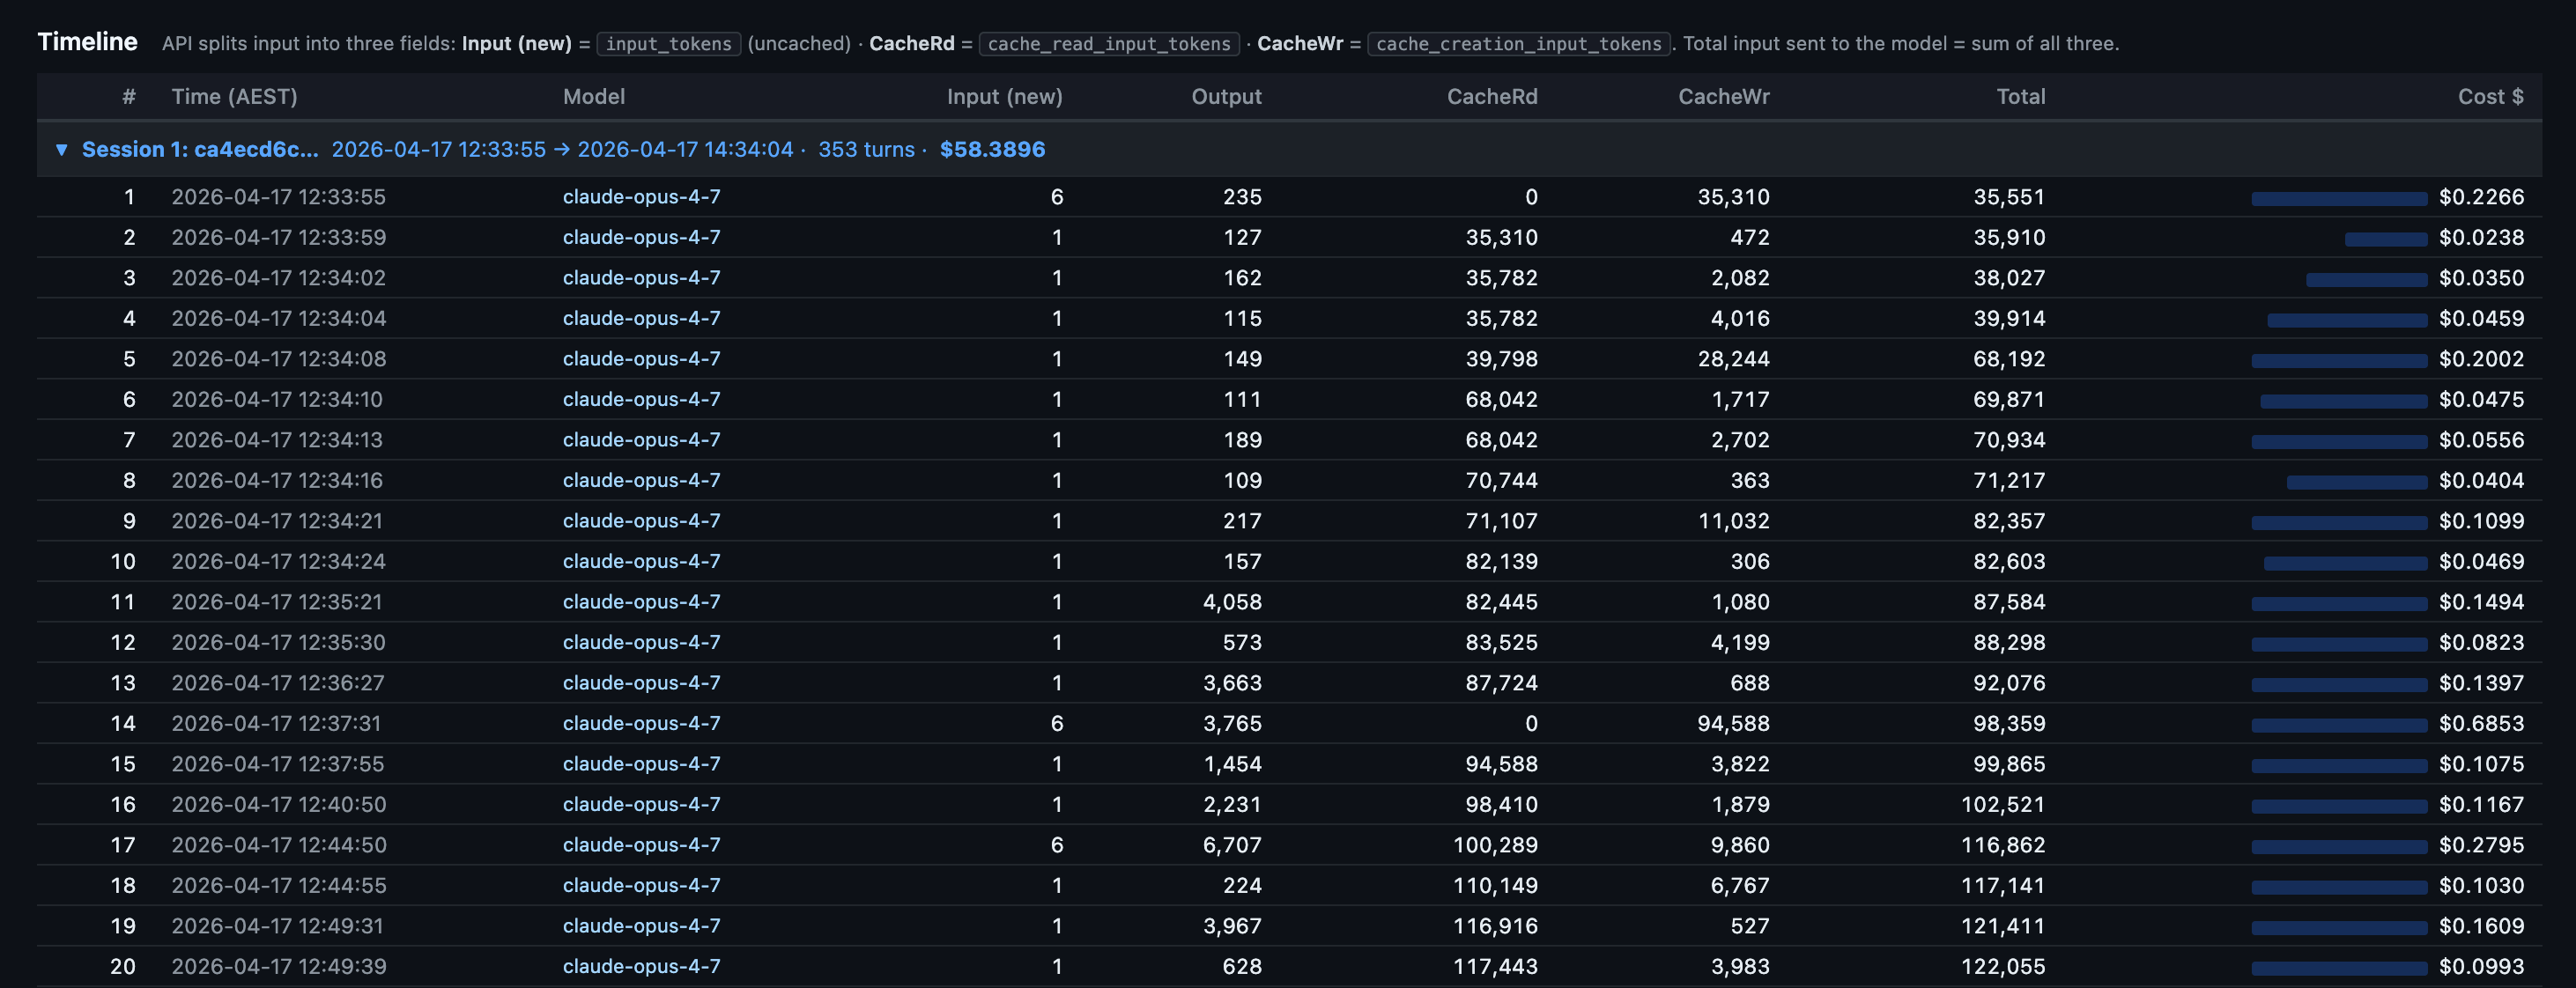
Down at the row level, every turn has a local-timezone timestamp (AEST in my case, since the skill now exports in the user’s own timezone), model name, and full token breakdown:
What this view tells you that nothing else does:
Where the cache breaks. A row with cache reads at 0 and cache writes spiking is the moment your prefix changed. Edit a CLAUDE.md mid-session and you’ll see it on the very next row.
The cost shape per session. Session 1 here ran 353 turns and cost $58.39. Most of that is the first 20 turns where the cache is being built. After that, each turn rides cheap.
Idle gaps. Local-timezone timestamps make it obvious when you walked away. On Pro (5-min cache TTL) any gap longer than 5 minutes is a guaranteed full re-cache on return. On Max (1-hour TTL) you have more room.
Roll-ups across all sessions in the project sit below the chart:
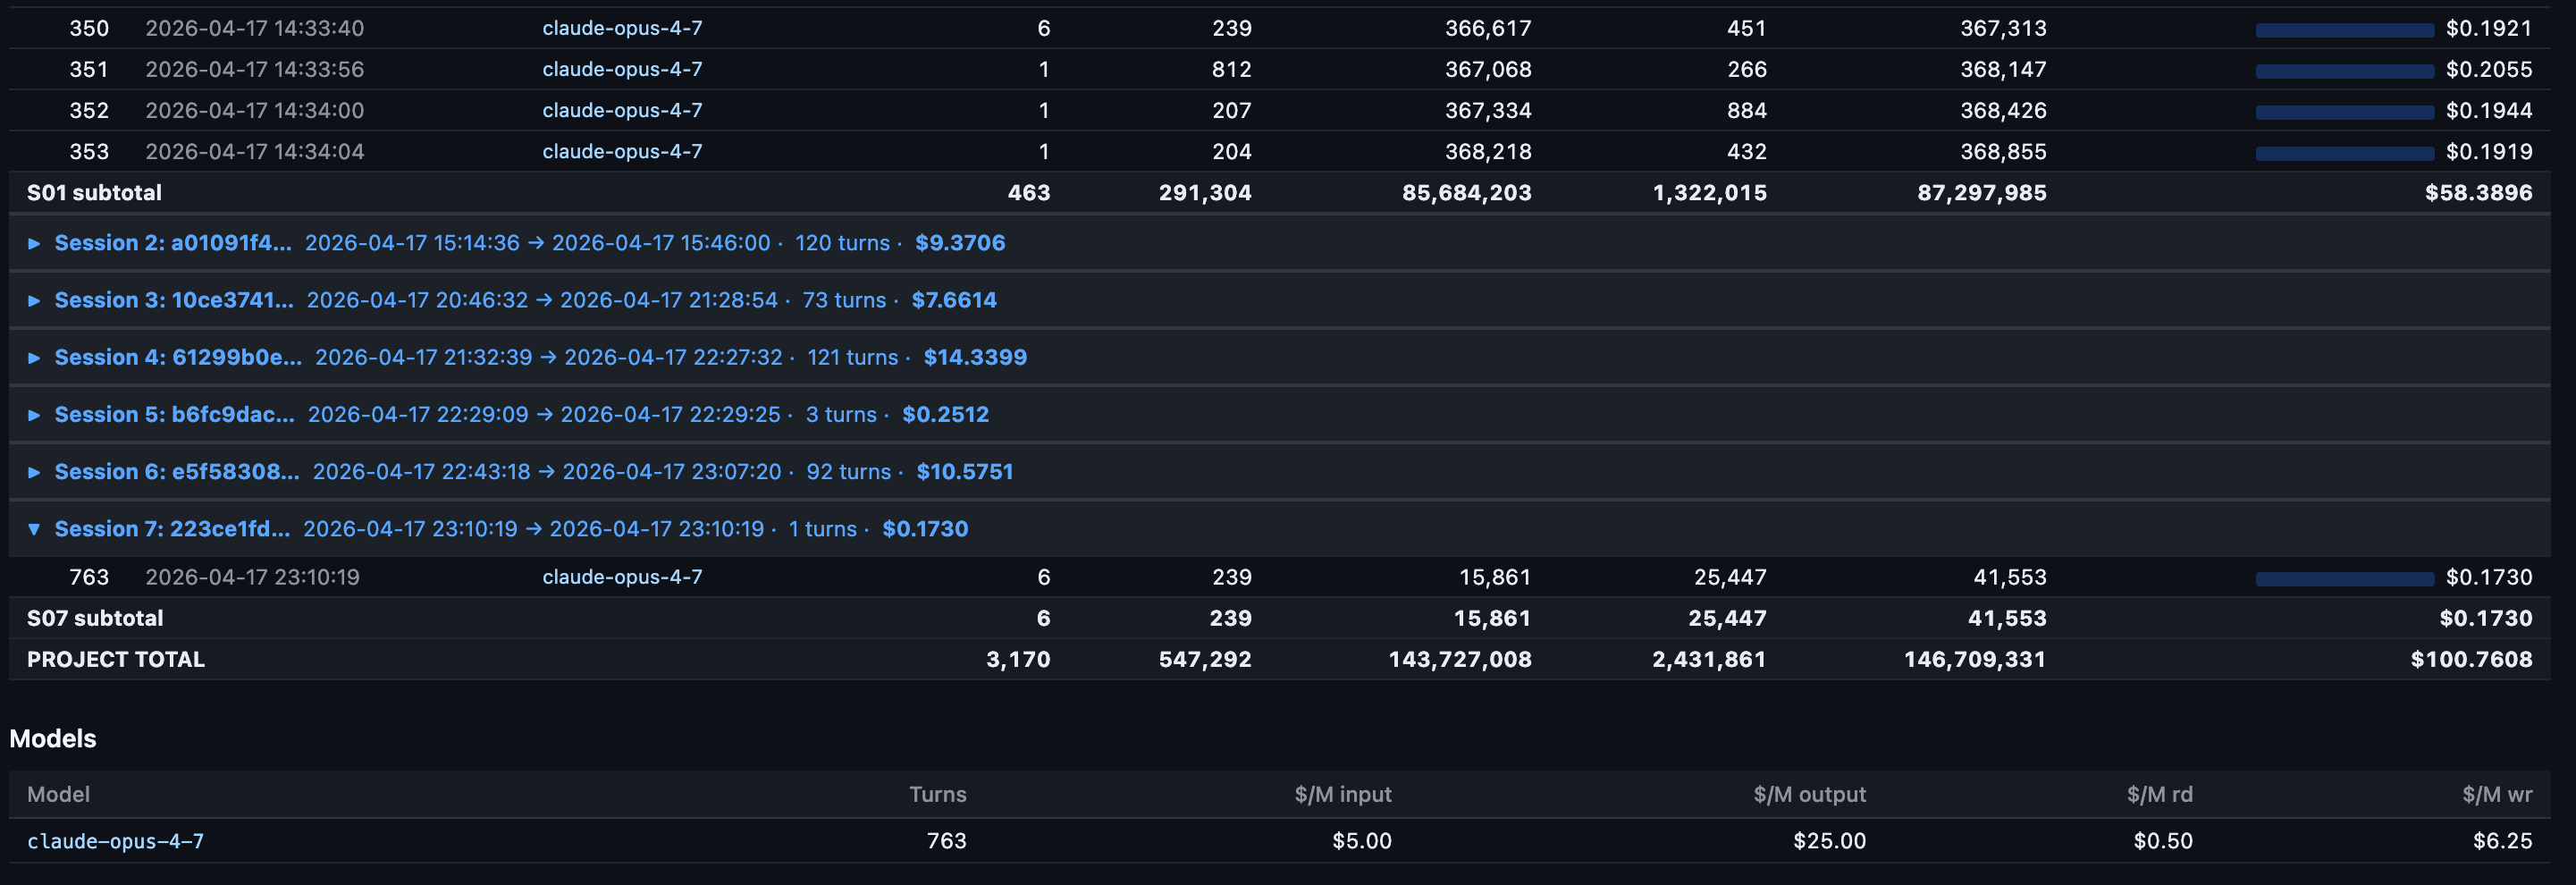
Notice the model row at the bottom. Every turn ran on claude-opus-4-7. No mid-session model switches, no Sonnet drop-ins. That matters because each model maintains its own cache. Switching mid-session forces a full re-cache write of the entire prior context. On a 92K-token context that single switch costs around $1.73 in re-cached input. I covered why in the companion piece.
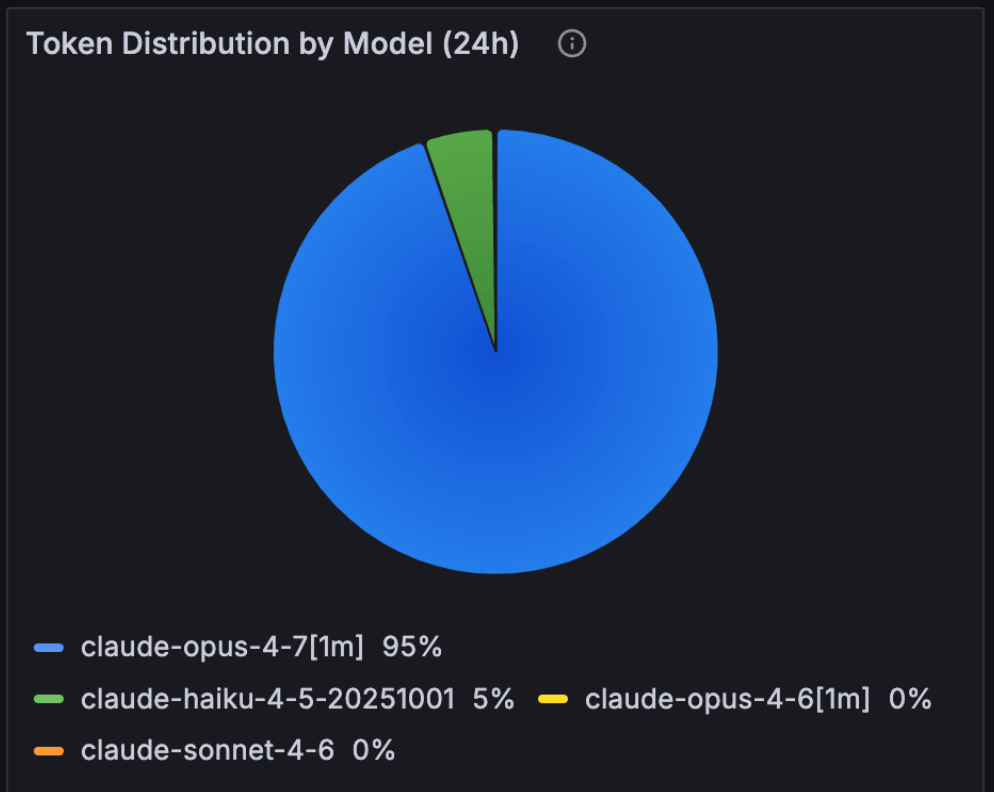
~95% usage was with Claude Opus 4.7 1 million token model.
The skill also breaks down user-prompt timing:
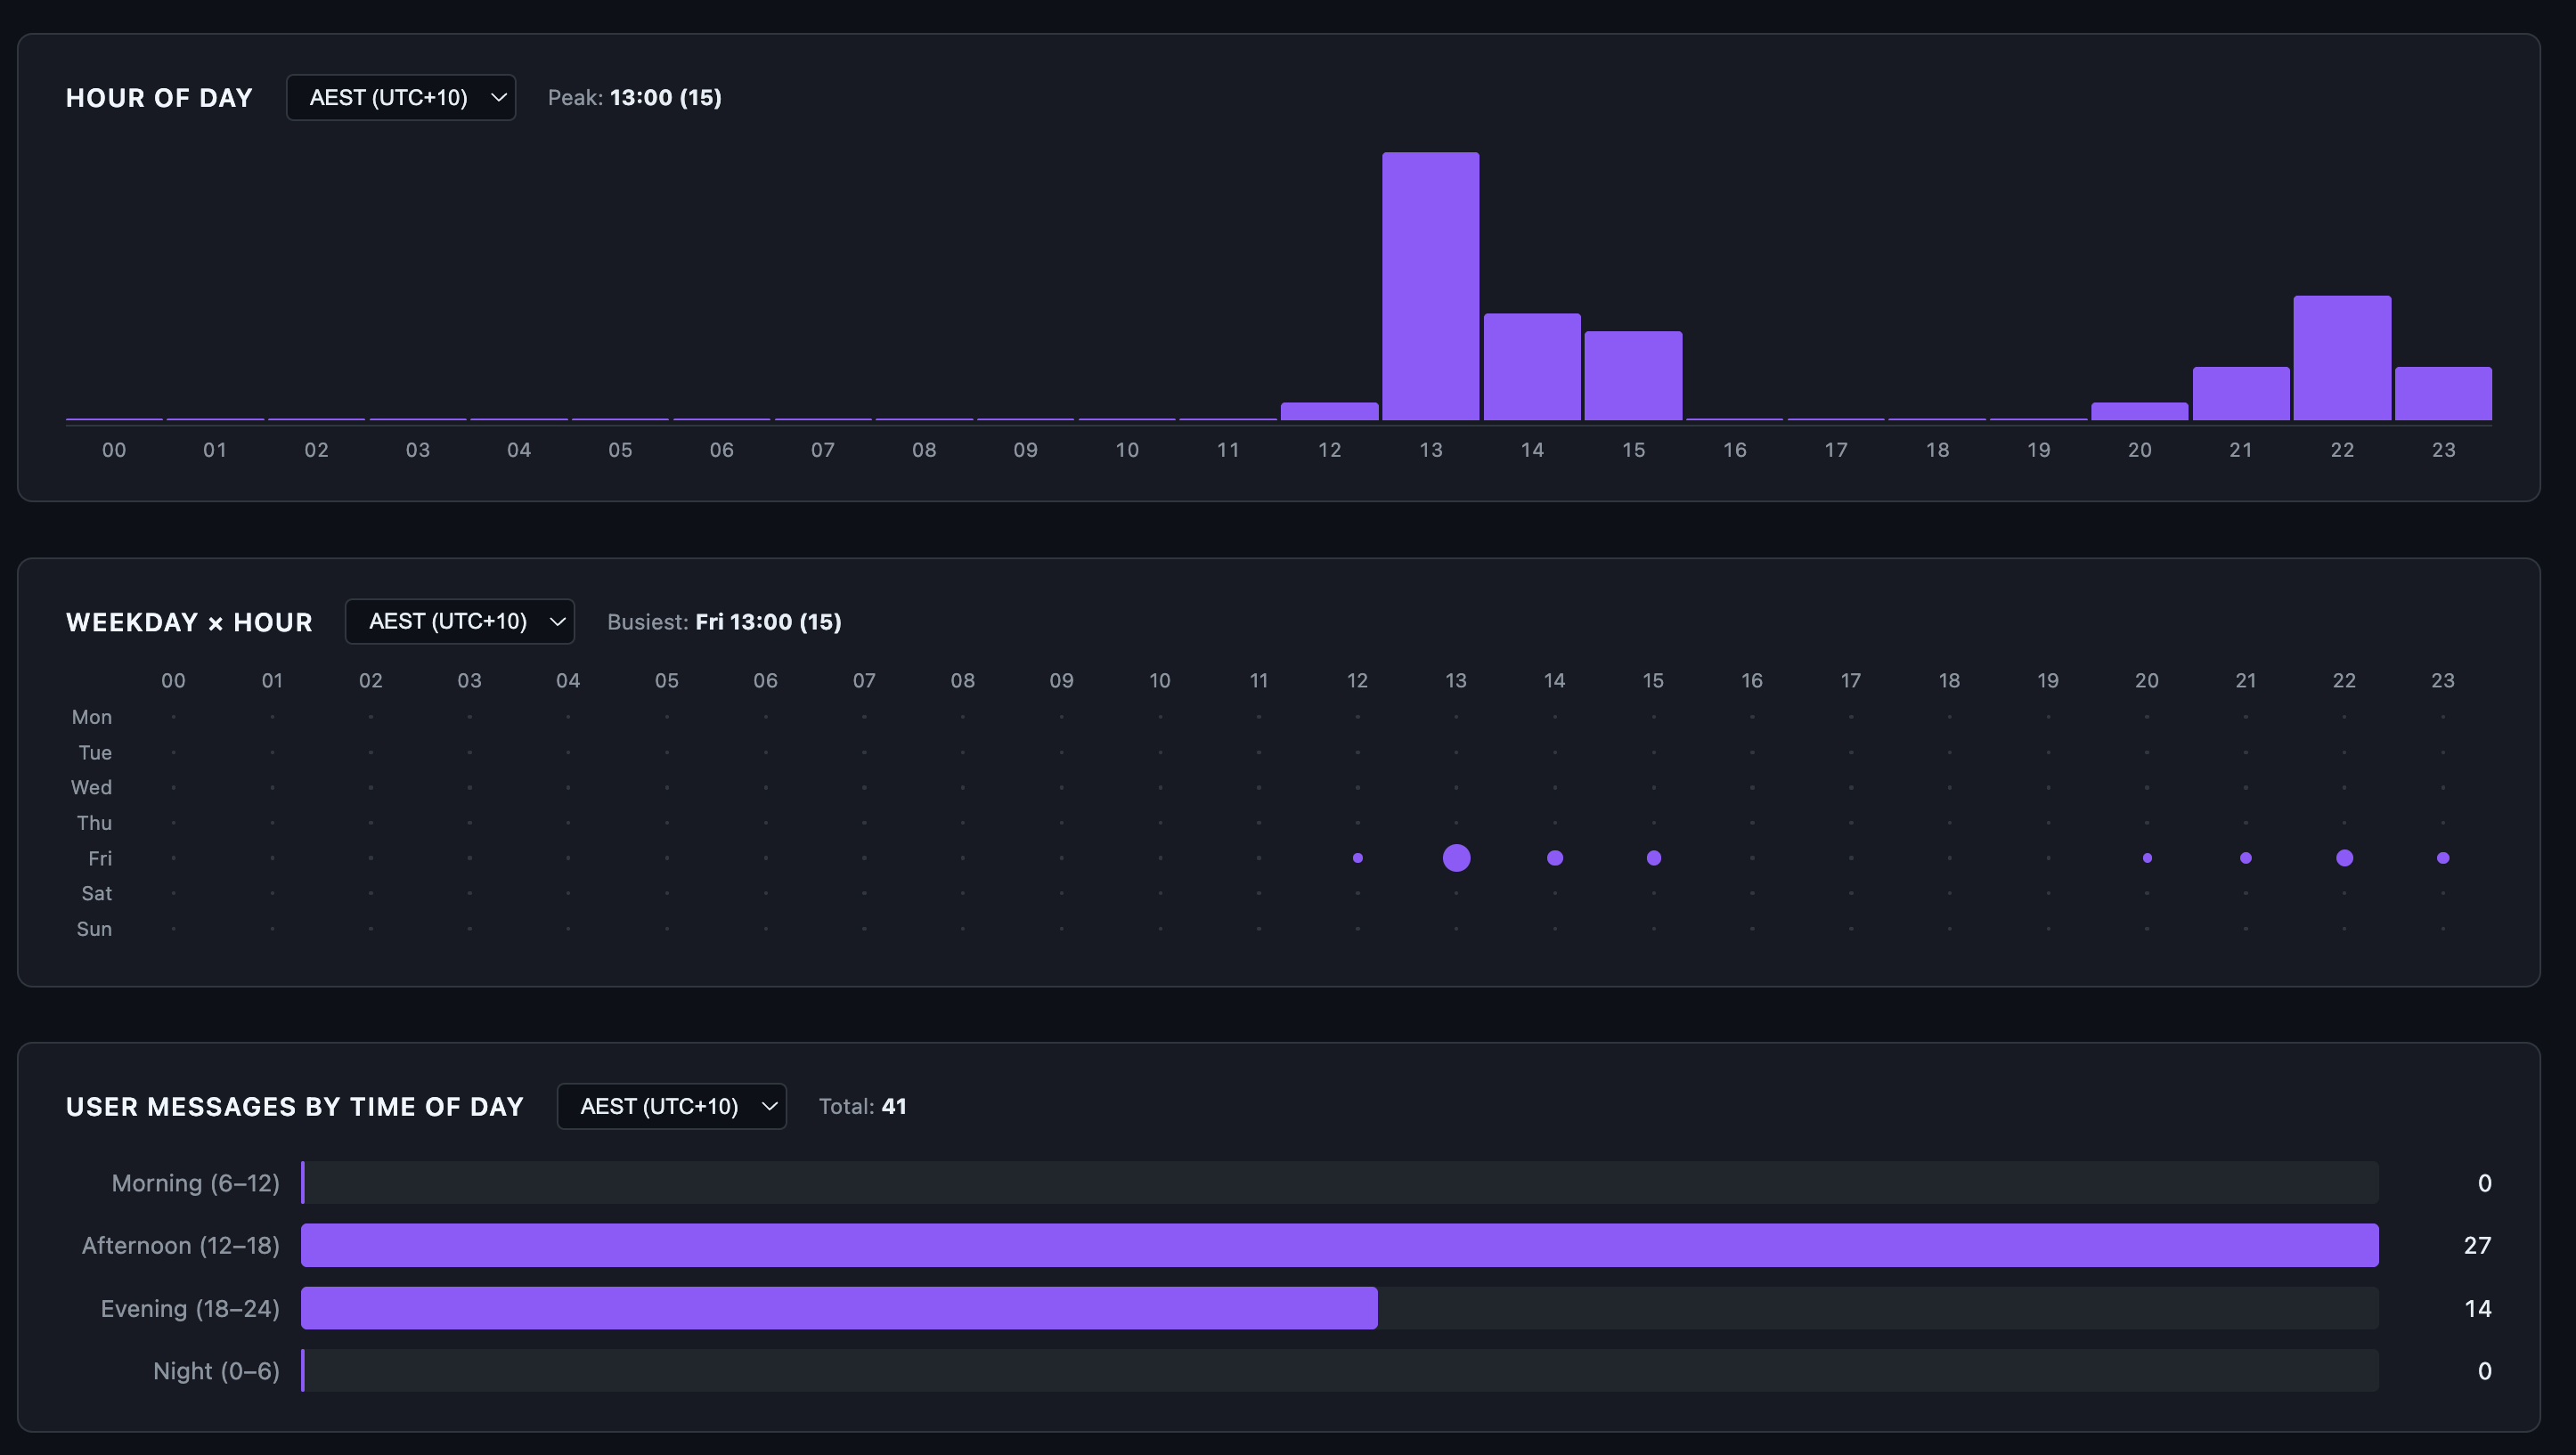
41 user prompts spread across the afternoon and evening. Zero in the morning, zero overnight. Brisbane afternoon (12:00-18:00) overlaps US Pacific evening, which is firmly off-peak for Anthropic’s documented weekday 5-11 AM PT crunch window. The peak in the chart is 13:00 AEST (15 prompts) which is roughly 8 PM the previous day in PT. I usually try to keep my Claude Code sessions now within Anthropic’s designated off-peak time, which is 5am to 10pm AEST Brisbane time so that my 5-hour sessions do not get consumed as quickly as they do in peak hour.
Surface 2: aggregate view in OpenTelemetry Grafana
Claude Code emits OpenTelemetry metrics if you wire OTEL_* environment variables into its config. I run a Prometheus + Loki + Grafana stack at home and pipe everything into a custom dashboard. This is the macro view of the same day:
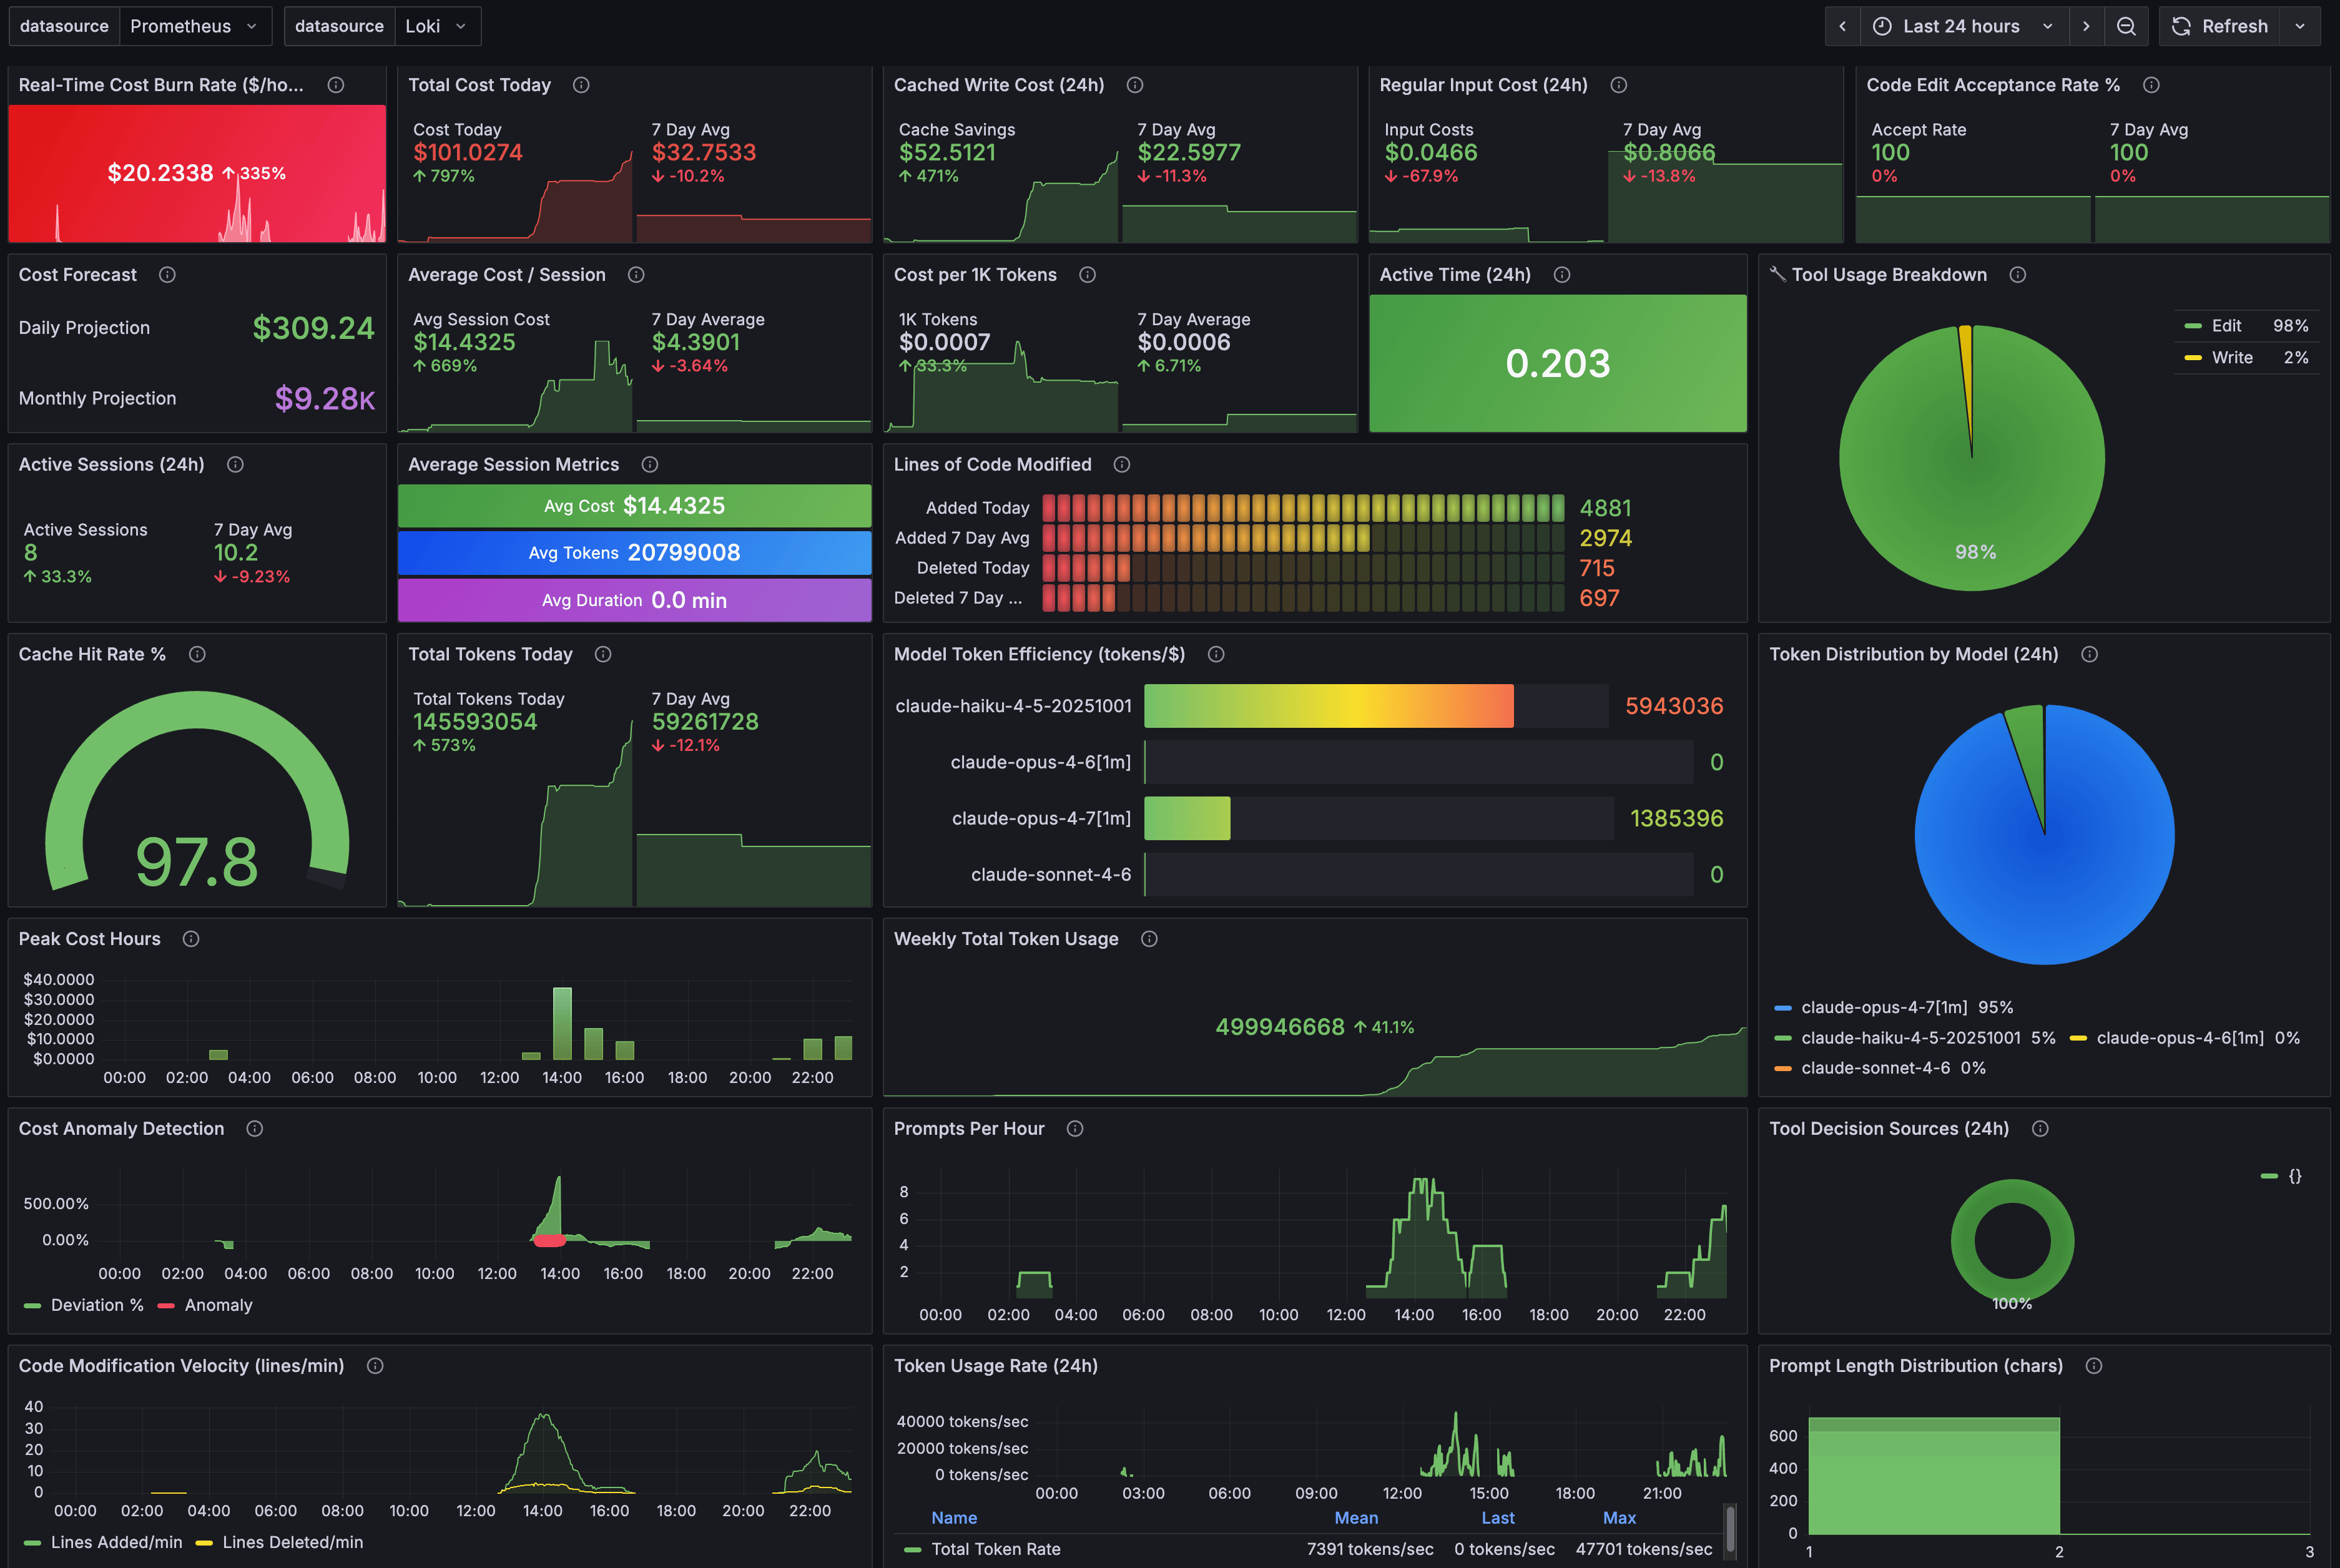
The big green 97.8% gauge in the centre is the all-time cache hit rate across every Claude Code project I run, not just this one. The session-metrics skill reported 98.3% for the day’s 7 sessions. The 0.5% gap is the difference between “this project today” and “all projects all time”. Both numbers describe the same behaviour: prompt caching is doing the work.
Some things stand out in Grafana dashboard:
Real-time burn rate of $20.23/hr is high but bounded. A 5-hour block at that rate caps out around $100, which is exactly what block 1 came in at.
Cost per 1K tokens is $0.0007. That’s the blended figure across all caches. Without caching it would be roughly 10x that.
Total Tokens Today: 145.6M, Weekly Total Token Usage: 499.9M. The day was 29% of the week’s tokens. Usually I consume anywhere between 100 and 500 million tokens per day and up to 1.65 billion tokens per week. This has been a slow week because I’ve been playing with Claude Code Desktop and Claude Cowork, which the Claude Cowork OpenTelemetry does not expose for non-enterprise users. Would love to have Claude Cowork exposed OpenTemetry metrics that can be exported to my Grafana instance.
Grafana is the right surface if you want to see trends, alert on anomalies, and forecast monthly burn. It is the wrong surface for “what did turn 19 actually cost”. For that, you go back to surface 1.
Surface 3: the official Claude.ai usage panel
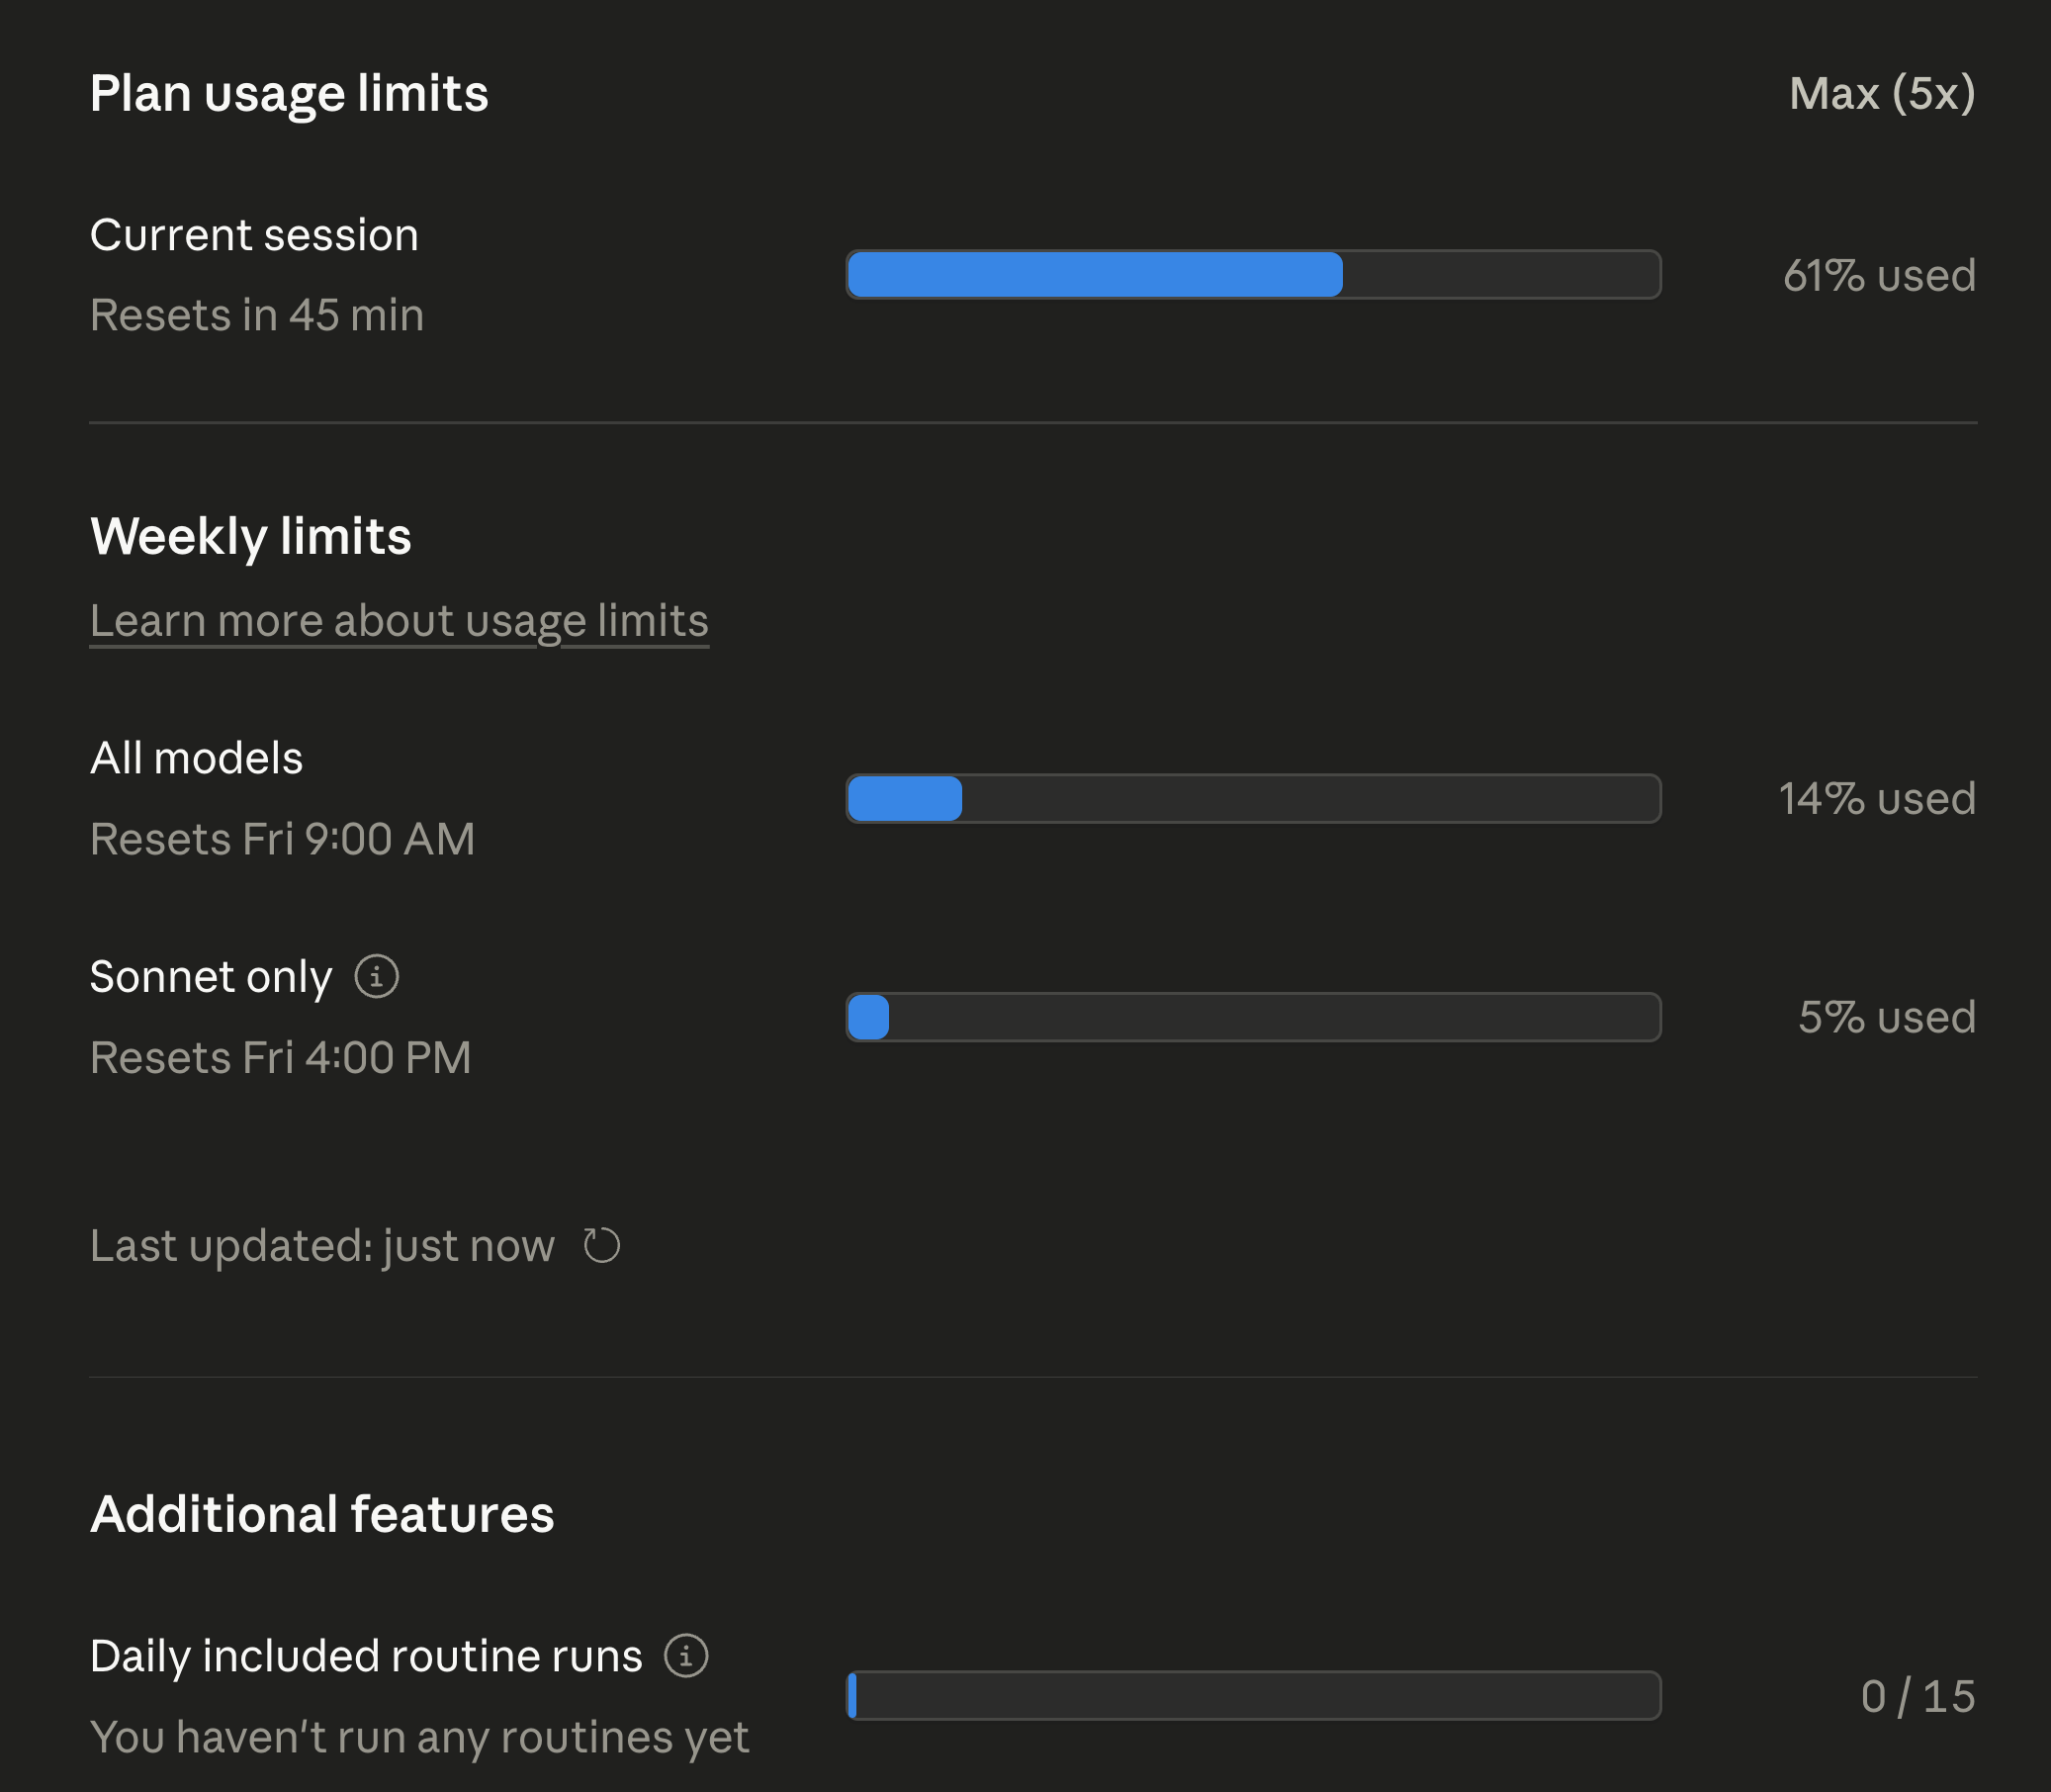
Anthropic added a Plan Usage Limits panel inside Claude.ai for Max subscribers. It’s the only surface that knows what your subscription’s actual cap is. The session-metrics skill and Grafana both report what you used in dollars and tokens. They can’t tell you what fraction of your quota that represents because they don’t see the cap.
After both blocks finished:
The numbers worth sitting with:
Current session: 61% used. That’s the active 5-hour block at the time of screenshot, with 45 minutes left. Not at the limit.
All models weekly: 14% used. After two heavy 5-hour blocks in the same day on Opus 4.7, I’m at 14% of my weekly all-models budget. Linear extrapolation says I could do 7 more days like this and still come in under cap. Realistically I won’t, but the headroom is large.
Sonnet only weekly: 5% used. I barely touched Sonnet 4.7 during these blocks. The Sonnet pool is its own bucket on Max plans, separate from the all-models bucket.
Daily included routine runs: 0/15. Routines are scheduled background tasks. I haven’t moved any workflows over yet, so this is untouched.
One caveat on the weekly numbers: Anthropic reset everyone’s weekly quota two days early this cycle because of widespread reports of Opus 4.7 burning through 5-hour blocks faster than expected. The 14% all-models and 5% Sonnet figures are post-reset usage, not a full week’s worth. Even with that asterisk, the headroom story holds - I ran two full Opus 4.7 blocks in one day and the bar barely moved.
This is the panel that determines whether you actually hit a limit. Everything else is informational. If the All-models bar isn’t full, you have headroom. If it is, no amount of session-metrics dashboarding is going to give you another turn.
Surface 4: the new Claude Code desktop stats
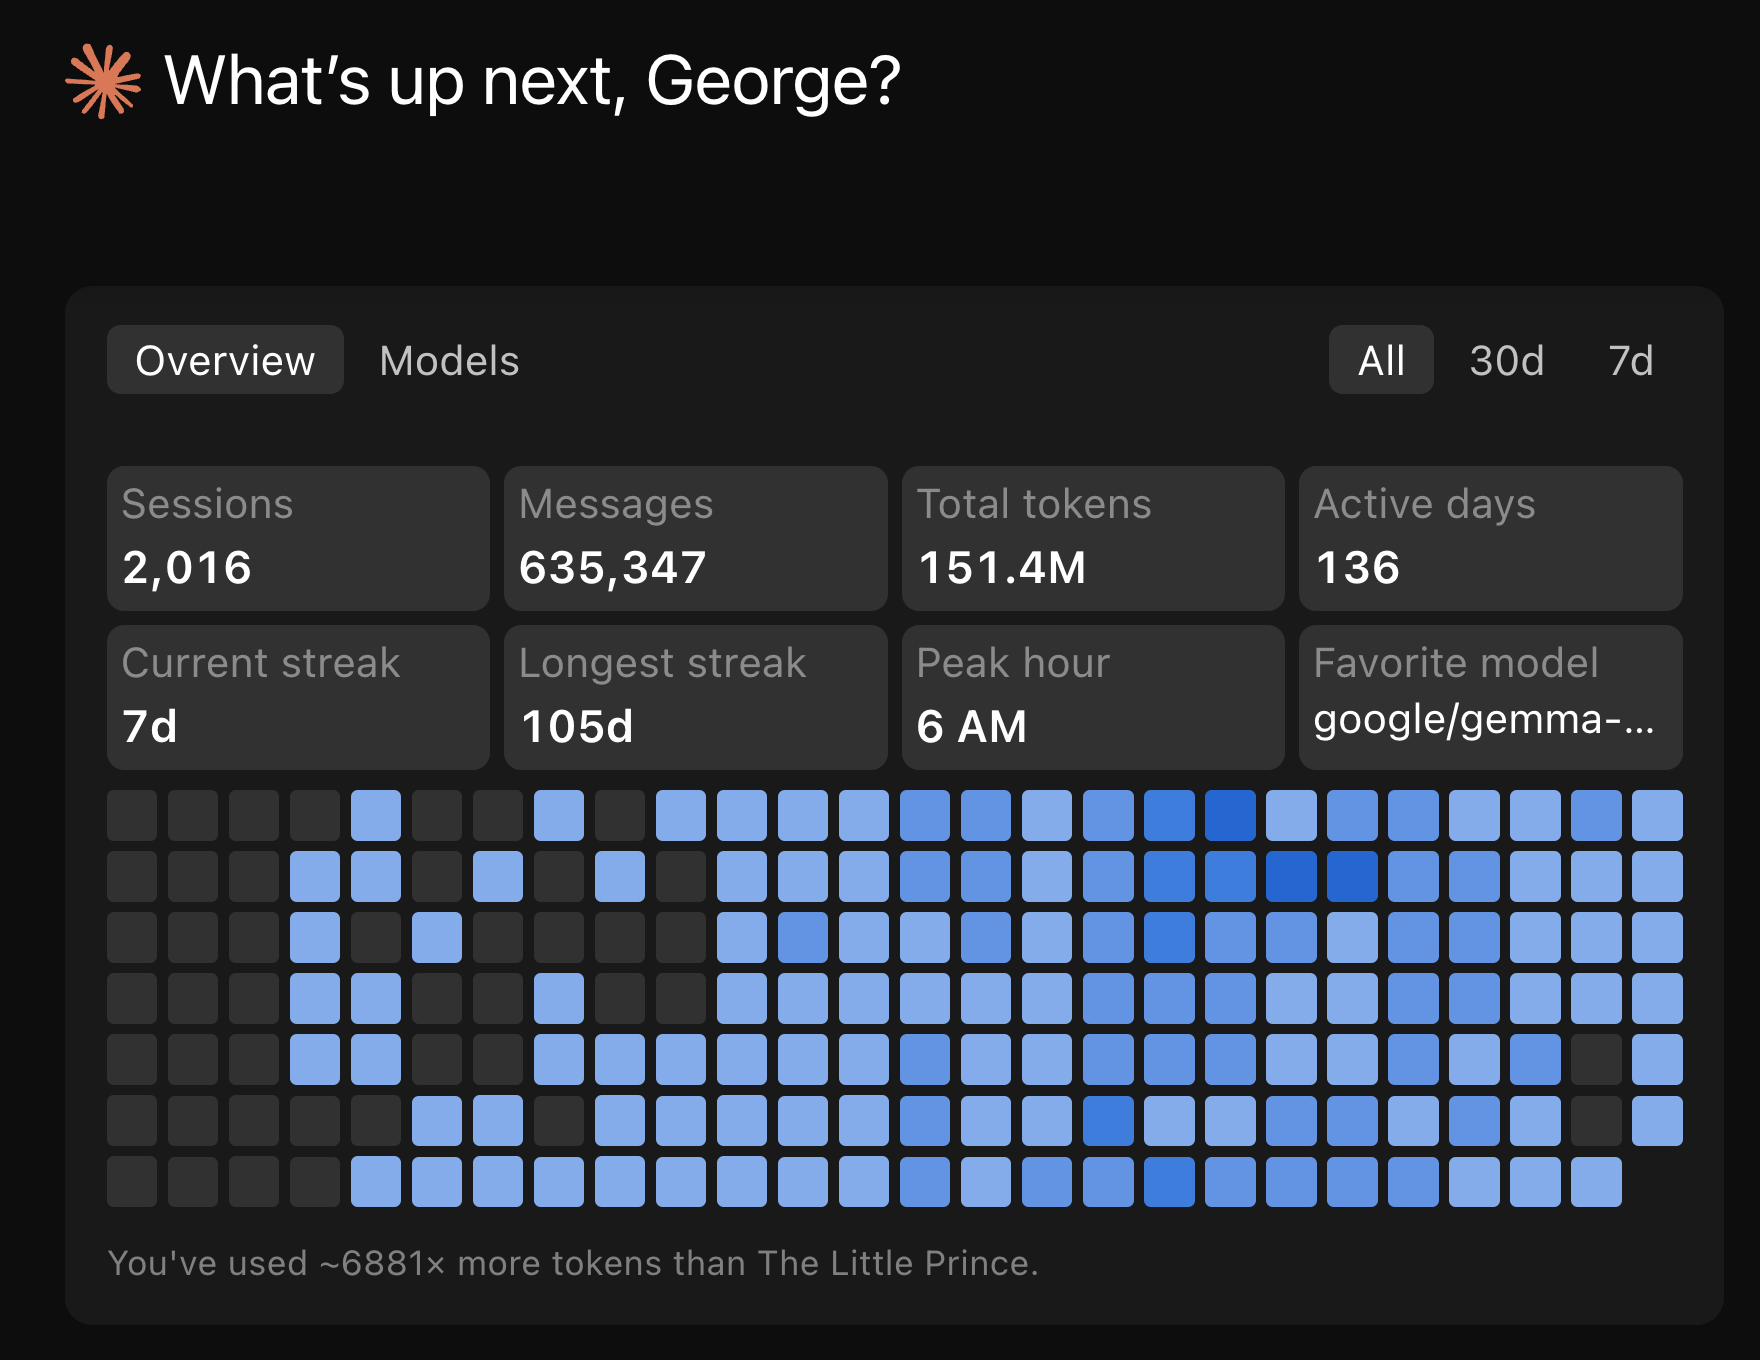
The Claude Code desktop app (the one announced alongside the Opus 4.7 launch) has a stats panel that nobody talks about. It rolls up your entire Claude Code history, not just one project, and surfaces it with a streak counter and a model breakdown.
A few of these numbers reframe everything I’ve shown above:
2,016 sessions, 151.4M total tokens, 136 active days. That’s lifetime across every project I’ve ever opened a Claude Code session in. The 763 turns from this single day are 0.5% of my lifetime usage. The $100.76 day is a heavy day, not a typical day.
Current streak 7d, longest streak 105d. I use Claude Code daily.
Peak hour 6 AM. Across all-time, my mode peak hour is 6 AM Brisbane time, which is 1 PM US Pacific the previous day. Claude’s Off-peak.
The Models tab spells it out:
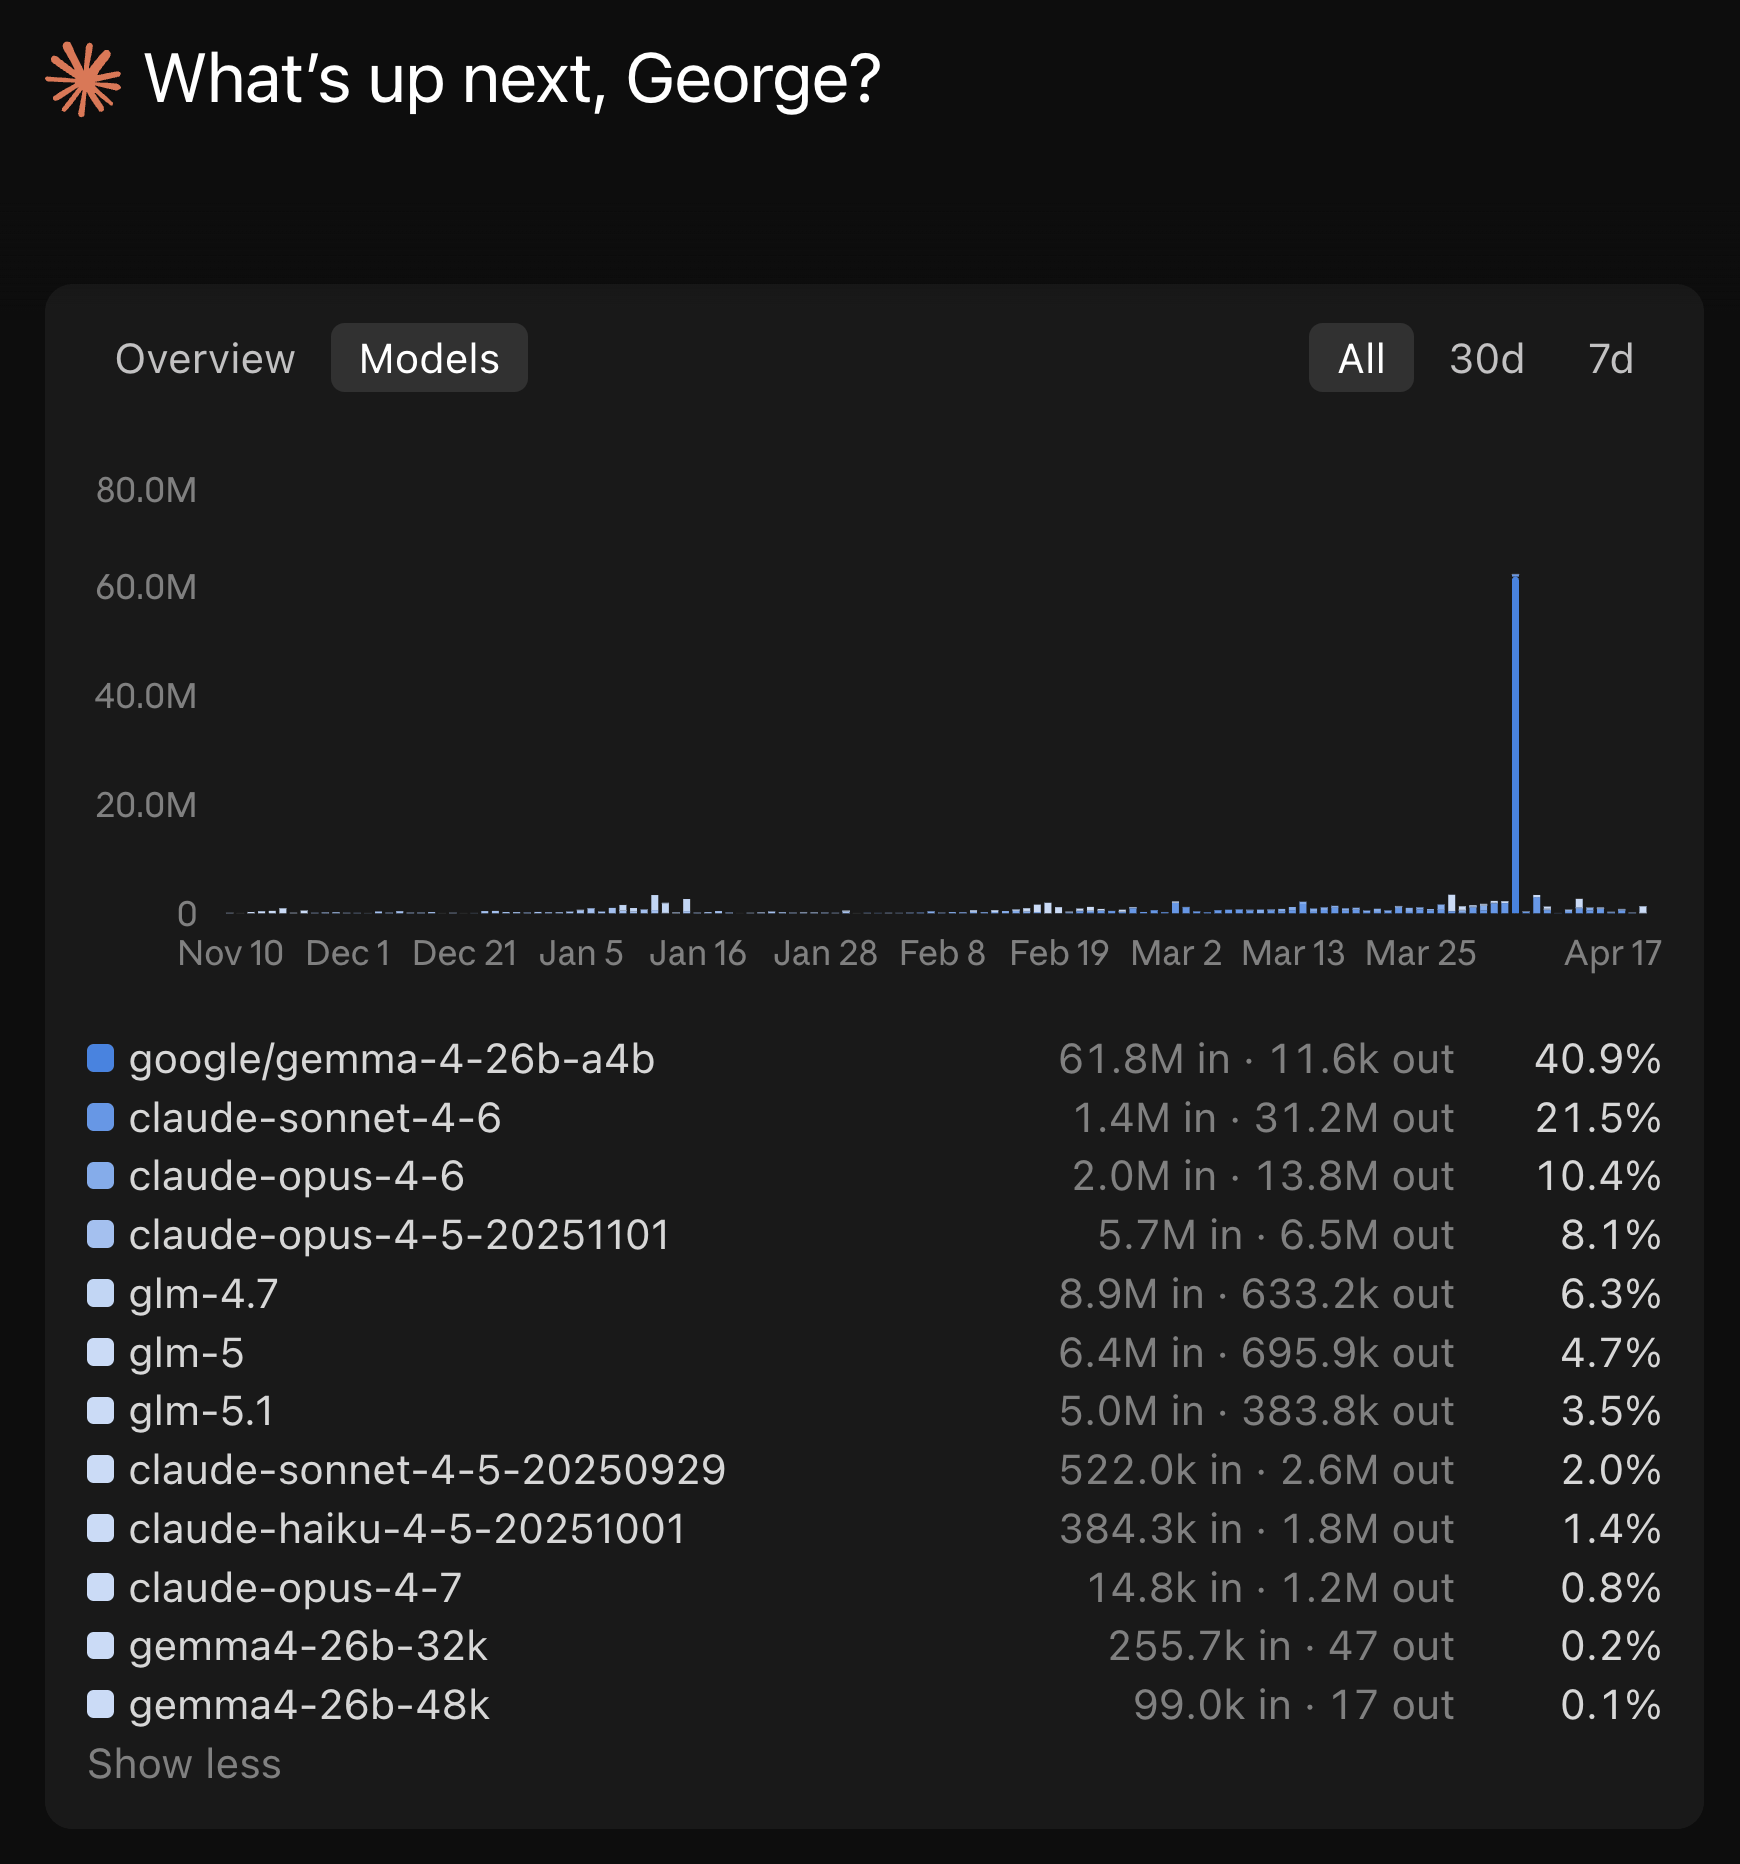
40.9% of my lifetime token usage is on Google Gemma 4 running locally via Ollama. That number is high because I was actively benchmarking local Gemma 4 inside the Claude Code harness for two earlier posts - Running Google Gemma 4 Locally With LM Studio’s New Headless CLI and Running Google Gemma 4 With Ollama, Claude Code, OpenCode, and Codex. Another 14.5% is on ZAI GLM (4.7, 5, 5.1) routed through my Z.AI Coding Pro plan subscription endpoint inside Claude Code. Only 0.8% is on Claude Opus 4.7, the model I just ran 763 turns through.
What I actually shipped in those two blocks
The two blocks weren’t open-ended exploration. They were focused work on the session-metrics skill itself. The skill was already running but needed an accuracy + production-readiness pass before public release. Block 1 covered the heavy lifting; block 2 was follow-up shape work.
Block 1 (12 of 12 planned steps):
Accuracy fix (HIGH severity).
_extract_user_timestampswas counting everytype:"user"JSONL entry, including auto-generatedtool_resultblocks. On tool-heavy sessions this inflated the user-activity histogram 10-20x. The fix was a_is_user_promptfilter that keeps only real user prompts and handles bothcontentshapes (list-of-blocks and plain string). Cost math was never affected. The bug was scoped to the activity histogram only.Input validators and security hardening.
_SESSION_RE,_SLUG_RE,_validate_session_id,_validate_slug, and_ensure_within_projectsto block path traversal, symlink escape, and absolute-path injection. Slug regex preserves leading-(Claude Code’s project slugs sometimes start with a dash and an earlier.lstrip("-")was stripping it).Pricing table with explicit Opus 4.7 entry. Added
claude-opus-4-7andclaude-sonnet-4-7to the pricing table. Same rates as 4.6 at this snapshot. Cost math already worked via prefix fallback, but the model display now reads correctly.Test harness (24 tests).
tests/fixtures/mini.jsonlwith 12 hand-crafted lines covering both content shapes, tool_results, isMeta, sidechain, dedup behaviour, and a 5h+ gap. Pytest is the only dependency. All 24 tests pass.Timezone infrastructure.
_local_tz_offset,_local_tz_label,_resolve_tz,--tzand--utc-offsetCLI flags. The footer now reads “User prompts by time of day (AEST)” instead of “User activity by time of day (UTC)”. The wording change reflects the bug fix; the data is now user prompts only.Hour-of-day, weekday punchcard, 5-hour session blocks. New views, all wired into every export format. The 5-hour block view is the one I lean on most. It’s how I anchored block 1 and block 2 in the table at the top of this post.
Peak-hour overlay.
--peak-hours H-Hplus--peak-tz <IANA>flags with a translucent band on the hour-of-day chart that re-shifts client-side when you change display tz. Labelled “unofficial, community-reported” because Anthropic has not formally documented the peak windows.Weekly roll-up + session duration cards. Trailing 7d vs prior 7d with percentage deltas. “new” replaces infinite percentages when the prior period is empty.
2-page HTML split. HTML export now emits
<stem>_dashboard.htmland<stem>_detail.html. Dashboard loads in 6% of the single-page size because it skips the inlined Highcharts bundle.--single-pagekeeps the legacy single-file output for archive use.Parse cache. Per-JSONL gzipped cache at
~/.cache/session-metrics/parse/keyed on(stem, mtime_ns, script_version). Measured 11.6 ms vs 99.8 ms on a 4 MB JSONL. About 9x speedup on a re-run.Vendored Highcharts. JS bundle now lives at
scripts/vendor/charts/highcharts/v12/with amanifest.jsonrecording SHA-256 per file. Hashes verified at render time. No more first-run CDN fetch. The--chart-lib noneflag emits a tiny detail page with no JS dependency.Pricing tier correction. Anthropic moved Opus 4.5-generation models (4.5, 4.6, 4.7) onto a new $5 input / $25 output tier when 4.5 launched, while leaving Opus 4 and 4.1 on the original $15/$75 tier. The pricing table had everything on the old tier. Cost figures for Opus 4.5-generation sessions were overstated by roughly 3x. Regenerate exports after upgrading to see corrected totals.
Block 2 was the polish + publishing pass:
uPlot and Chart.js renderers as MIT-licensed alternatives to vendored Highcharts (which has a non-commercial-free clause).
--chart-lib {highcharts,uplot,chartjs,none}dispatch.Publish-readiness + downstream sync model. The skill is part of a marketplace I’m preparing. Block 2 worked through what needs to be true before the first public push, including documentation of every gotcha (sticky
nameinmarketplace.json,strictdefault,gh repo create --publicbeing irreversible).First-time marketplace publish walkthrough docs. Full walkthrough in
CLAUDE.mdso the step sequence doesn’t have to be reconstructed from chat history later.Local-timezone timestamps in human-facing exports. Every human-facing timestamp now renders in the user’s local timezone with a
(AEST)or(PT)suffix.
That’s the work that produced the $100.76 number in the dashboard. It also explains why session 1 alone was 353 turns and $58.39: a 12-step plan, with each step including its own audit, code, tests, and history-entry commit, runs hot on tool calls.

What stops me hitting the limits
These are the habits that keep my numbers in the green across all four surfaces. Some of them I’ve covered before. The two 5-hour blocks above are the receipts.
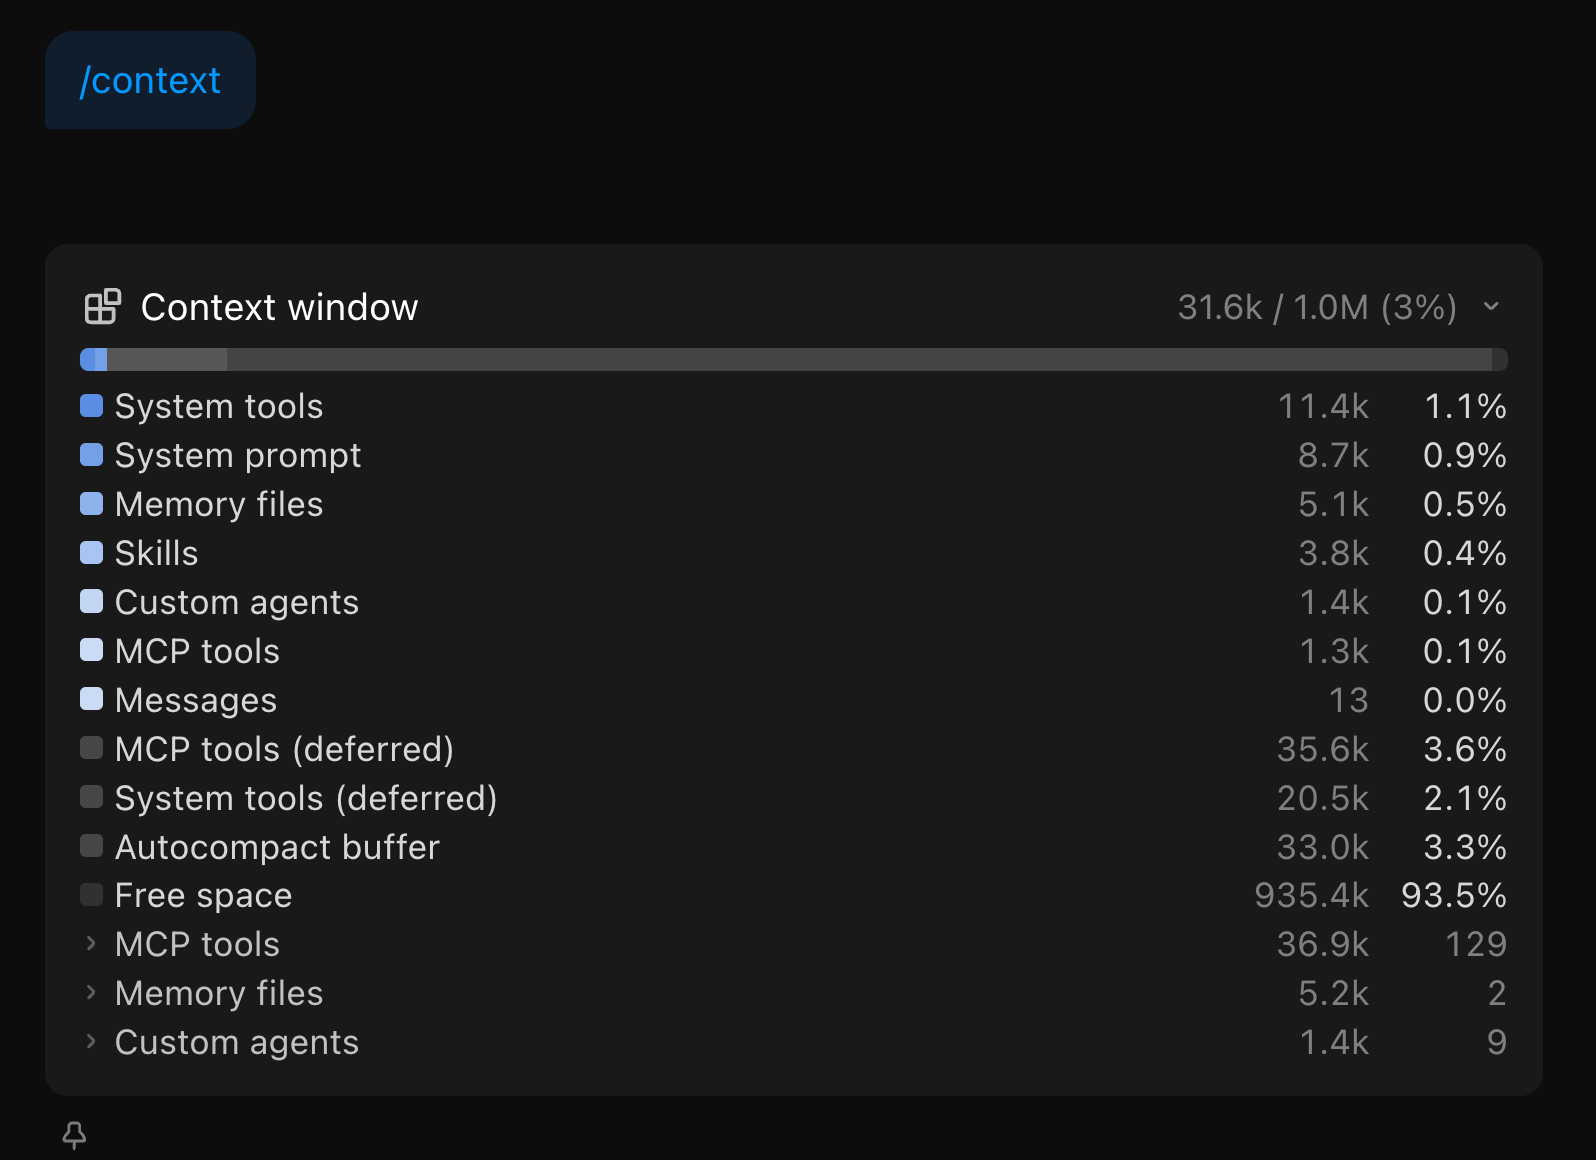
Stay on one model per session. Every turn in those 763 ran on claude-opus-4-7. Switching models mid-session forces a full re-cache write. On a 92K-token context that’s roughly $1.73 per switch at Opus cache-write pricing. Do it a few times in a session and you erase the savings caching was giving you. If I need Sonnet for cheap work, I start a new session. Though your mileage will vary depending on your usage patterns. Within Claude Code, regularly check the output for /context to see what is consuming your context before, during and after a chat session. The Claude Code CLI has more detailed /context output listing compared to Claude Code desktop app.
Don’t edit CLAUDE.md mid-session. Any change to the conversation prefix invalidates the cache from that point forward. I edit between sessions, never during.
Watch the cache TTL. Max gives a 1-hour TTL. Pro gives 5 minutes. A coffee break on Pro is a guaranteed cache miss on return. Within block 2 the inter-session gaps stayed under 15 minutes. Within block 1 there was a longer 41-minute gap between session 1 and session 2 - still inside the 1-hour Max TTL, so the cache held, but a Pro user with a 5-minute TTL would have eaten a full re-cache write at that point.
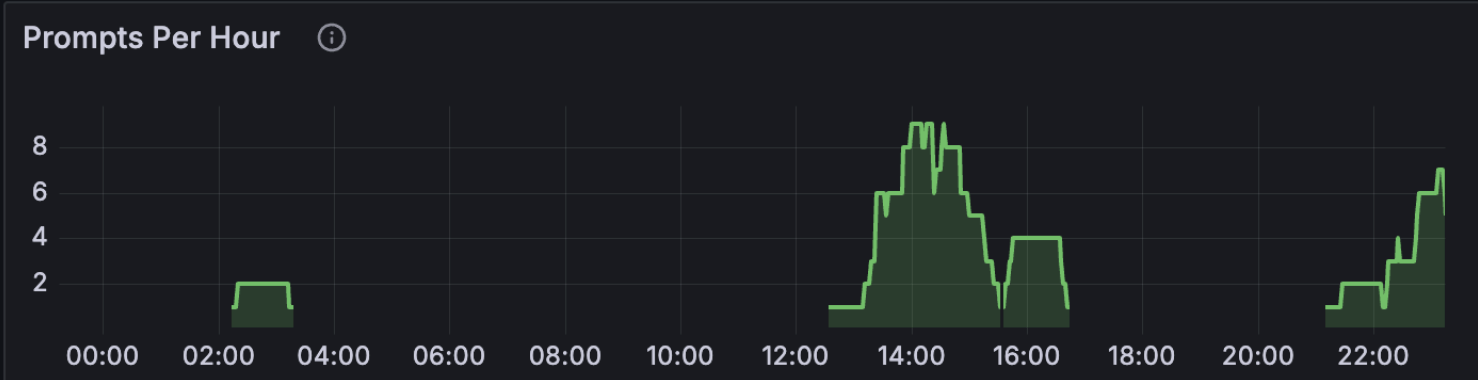
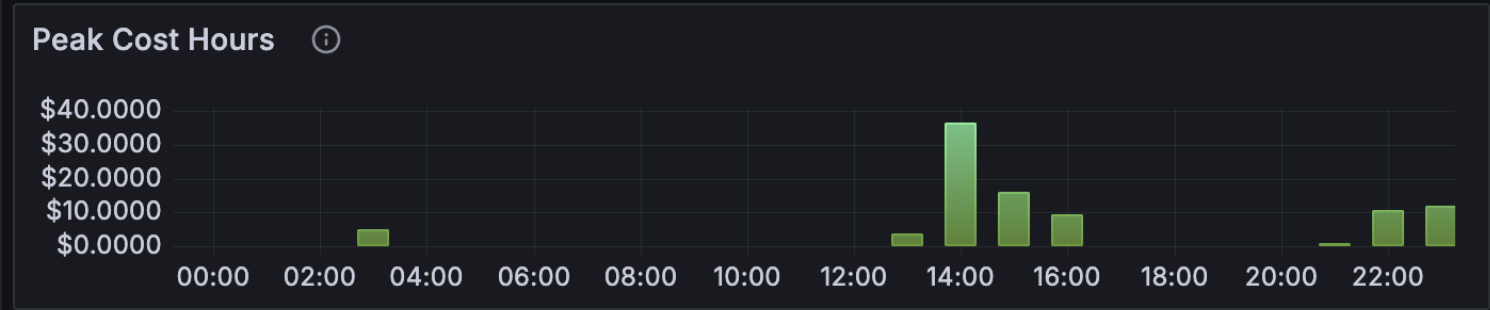
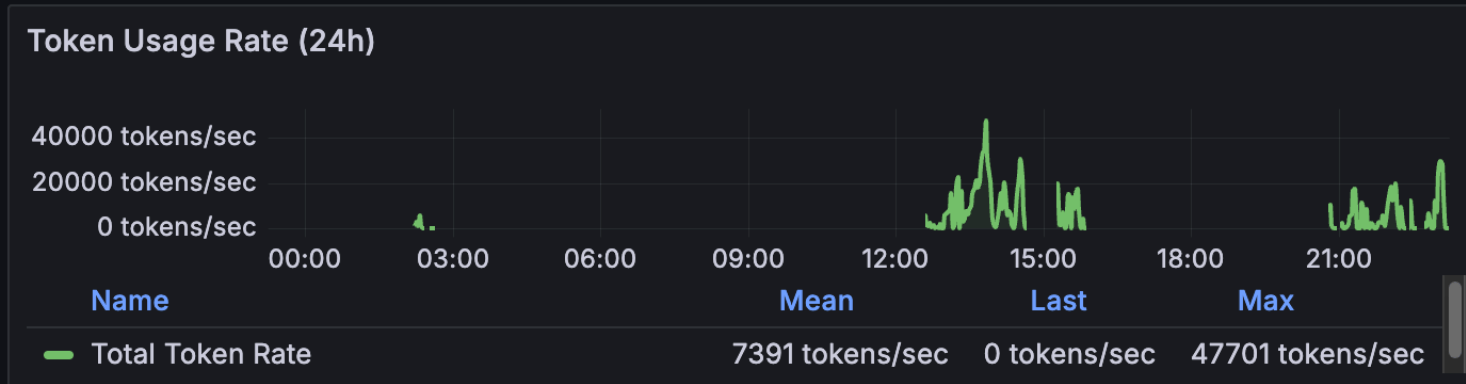
This is my Grafana logged prompts, costs, token usage and code modification rates over a 24hr period
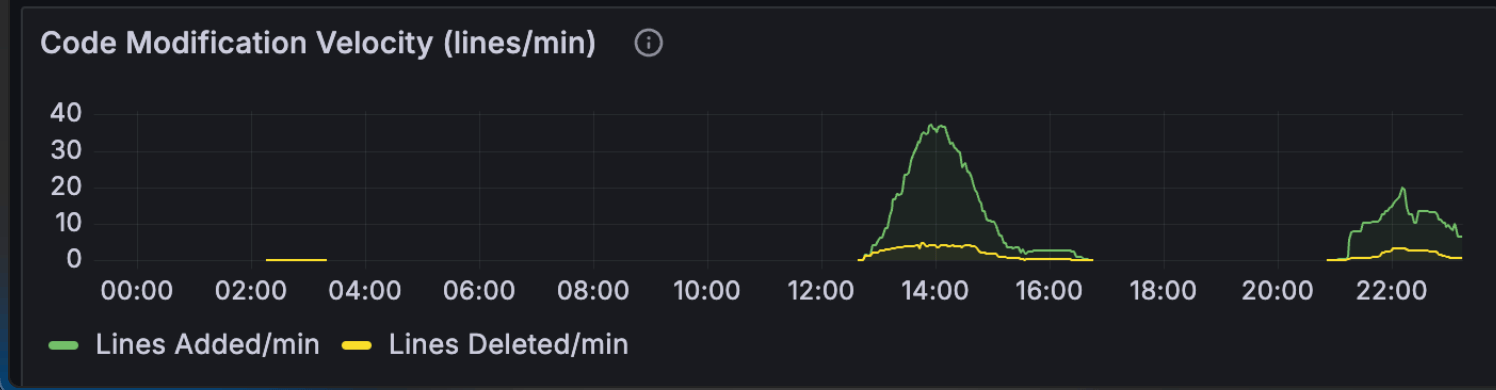
Code off-peak. Anthropic’s known peak window is weekdays 5-11 AM PT. I’m in Brisbane (UTC+10), so my afternoon and evening are US Pacific overnight to mid-morning. The hour-of-day chart confirms 27 of 41 prompts hit afternoon AEST and 14 hit evening AEST. Zero in morning, zero at night. This matters more than it used to: Anthropic has now officially acknowledged that 5-hour session blocks consume faster during peak hours than off-peak, which is part of why some users report blocks burning out in minutes. I covered the official guidance in Six Things to Change in Your Claude Code Workflow for Opus 4.7. Off-peak coding isn’t just nicer; it’s literally cheaper per minute of block time.
Use the 200K context window unless you actually need 1M. Both blocks used claude-opus-4-7 with the 1M context flag because the work involved holding the full skill source plus tests plus references in context. For most tasks the 200K default is enough and the cache-write amortisation is cheaper. The 1M context is worth it when the full surface area genuinely matters; otherwise it’s overhead.
Lean CLAUDE.md, lean SKILL.md. Both files load into every message in their respective contexts. The starter template at centminmod/my-claude-code-setup ships with MAX_THINKING_TOKENS=8192 in settings.local.json for that reason. Adaptive thinking is now the Opus 4.6+ default and is the better choice for most users. A fixed budget still makes sense if you need deterministic cost control.
One caveat on the CLAUDE.md advice. “Keep it lean” assumes you only run Claude models. I also run ZAI GLM 5.1 inside Claude Code. GLM 5.1 is capable, but at the brevity level where Claude handles progressive disclosure well, GLM 5.1 hits maybe 80% instruction-following accuracy. To close that gap to 90-95%, I had to add more explicit steering and guardrails in my CLAUDE.md and SKILL.md files. The unexpected side effect: those detailed instructions also appear to help Claude on days when developers report degraded Opus 4.6 performance. More explicit instructions leave less room for drift regardless of which model reads them. It’s a theory, but the correlation has been consistent enough that I trust it. The real advice: keep CLAUDE.md as short as possible for the least capable model you run through it. If you only use Claude, lean is fine. If you run multiple models, the extra tokens may pay for themselves in consistency.
Inspect what you actually used, not what you remember. The four surfaces in this post each tell you something the others can’t. Per-turn detail lives in surface 1. Trends live in surface 2. Quota state lives in surface 3. Lifetime mix lives in surface 4. If a complaint is going to land for me, it’ll show up on surface 3 first; everything else is diagnostic.
What’s next
I want to use this session metric skill to be able to inspect future Claude Code coding sessions so I have an idea of what my token usage and costs are at the per-session level.
Also, I’m preparing the session-metrics skill for public release through a Claude Code plugin marketplace. When that ships I’ll write a short follow-up with the install instructions.
Update: the session-metric skill is now publicly available via my Claude Code plugin marketplace.
Two more inspection ideas I want to add to the skill itself: an annotation overlay on the hour-of-day chart for Anthropic’s documented peak window, and a side-by-side comparison view between two arbitrary sessions so you can see what changed between runs of the same prompt.
The longer-term piece is a Cloudflare Worker that serves the dashboard live instead of as static HTML files. That changes the read pattern from “regenerate when I want to look” to “always-on”, which is closer to how Grafana feels.
If you want practical AI building for web apps, dev workflows, and infrastructure, subscribe for future posts. You can also follow shorter updates on Threads (@george_sl_liu) and Bluesky (@georgesl.bsky.social).