
Claude Cowork Live Artifacts: First Run With My Claude Code Metrics MCP Server
A live artifact is an HTML page in Claude Cowork. It survives the session and calls your connectors for fresh data every time you open it

In this post:
What a live artifact is, in one paragraph
A live artifact is a self-contained HTML page that Claude Cowork saves to your sidebar that allows you to build dashboards and trackers connected to your apps and files. It differs from a regular chat artifact in three ways. It persists across sessions, so it is still there the next time you open Claude Cowork. It can be reopened like a browser tab, not re-requested from the model. And at open-time, it can call your connectors (MCP servers) directly from inside the page, so the numbers on screen are fresh every time. The sidebar just calls the tools again and re-renders.
What Claude Cowork’s sidebar calls “Live artifacts” is the same capability family Anthropic writes about as interactive connectors and MCP Apps. The public docs frame it as “tools showing up as interactive connectors right in the conversation,” and the help center article Use interactive connectors in Claude explains that “some connectors can now display live, interactive apps directly within your Claude conversations.” Claude Cowork picks up the same feature and surfaces it in its own sidebar with its own wording. Same underlying capability, two entry points.

If you have used Claude Code, think of it as a persistent HTML file generated by the model that is wired directly to your MCP tool schemas. If you have not used Claude Code, think of it as a Grafana panel where the datasource is your own Claude connectors, assembled by conversation.
The three properties that actually matter
Before I get to the build, I want to be specific about the three properties because they determine which problems this feature is good for.
It persists. A regular chat artifact lives and dies with the thread. If you close the tab, you have to ask the model to rebuild it. A live artifact sits in the Live artifacts section of the sidebar and survives session changes, app restarts, and project switches. You can reopen it tomorrow.
It re-opens without recomputing. When you click the sidebar entry, the HTML loads from storage. The model is not involved on reopen. That means no token cost, no round trip, no prompt queue. The only thing that runs is the JavaScript inside the artifact, which might make connector calls of its own.
It can call connectors from inside the page. This is the interesting one. The artifact has a browser-side bridge, window.cowork.callMcpTool, that lets the HTML invoke your MCP tools directly at open-time. So a cost dashboard can call get_current_cost the moment you click it and show today’s number, not a snapshot from when the artifact was created. Anthropic’s interactive connectors announcement puts the design principle this way: MCP Apps “lets any MCP server deliver interactive connectors with a rich user interface.” The live artifact is what that looks like inside Cowork.
Those three properties together define the sweet spot. A live artifact earns its keep when the data under it changes over time and you will want to look again later. A status tracker. A dashboard. A filtered explorer over a connector. If the data is static, a regular chat artifact or a markdown reply is fine.
Where the Metrics MCP server fits in
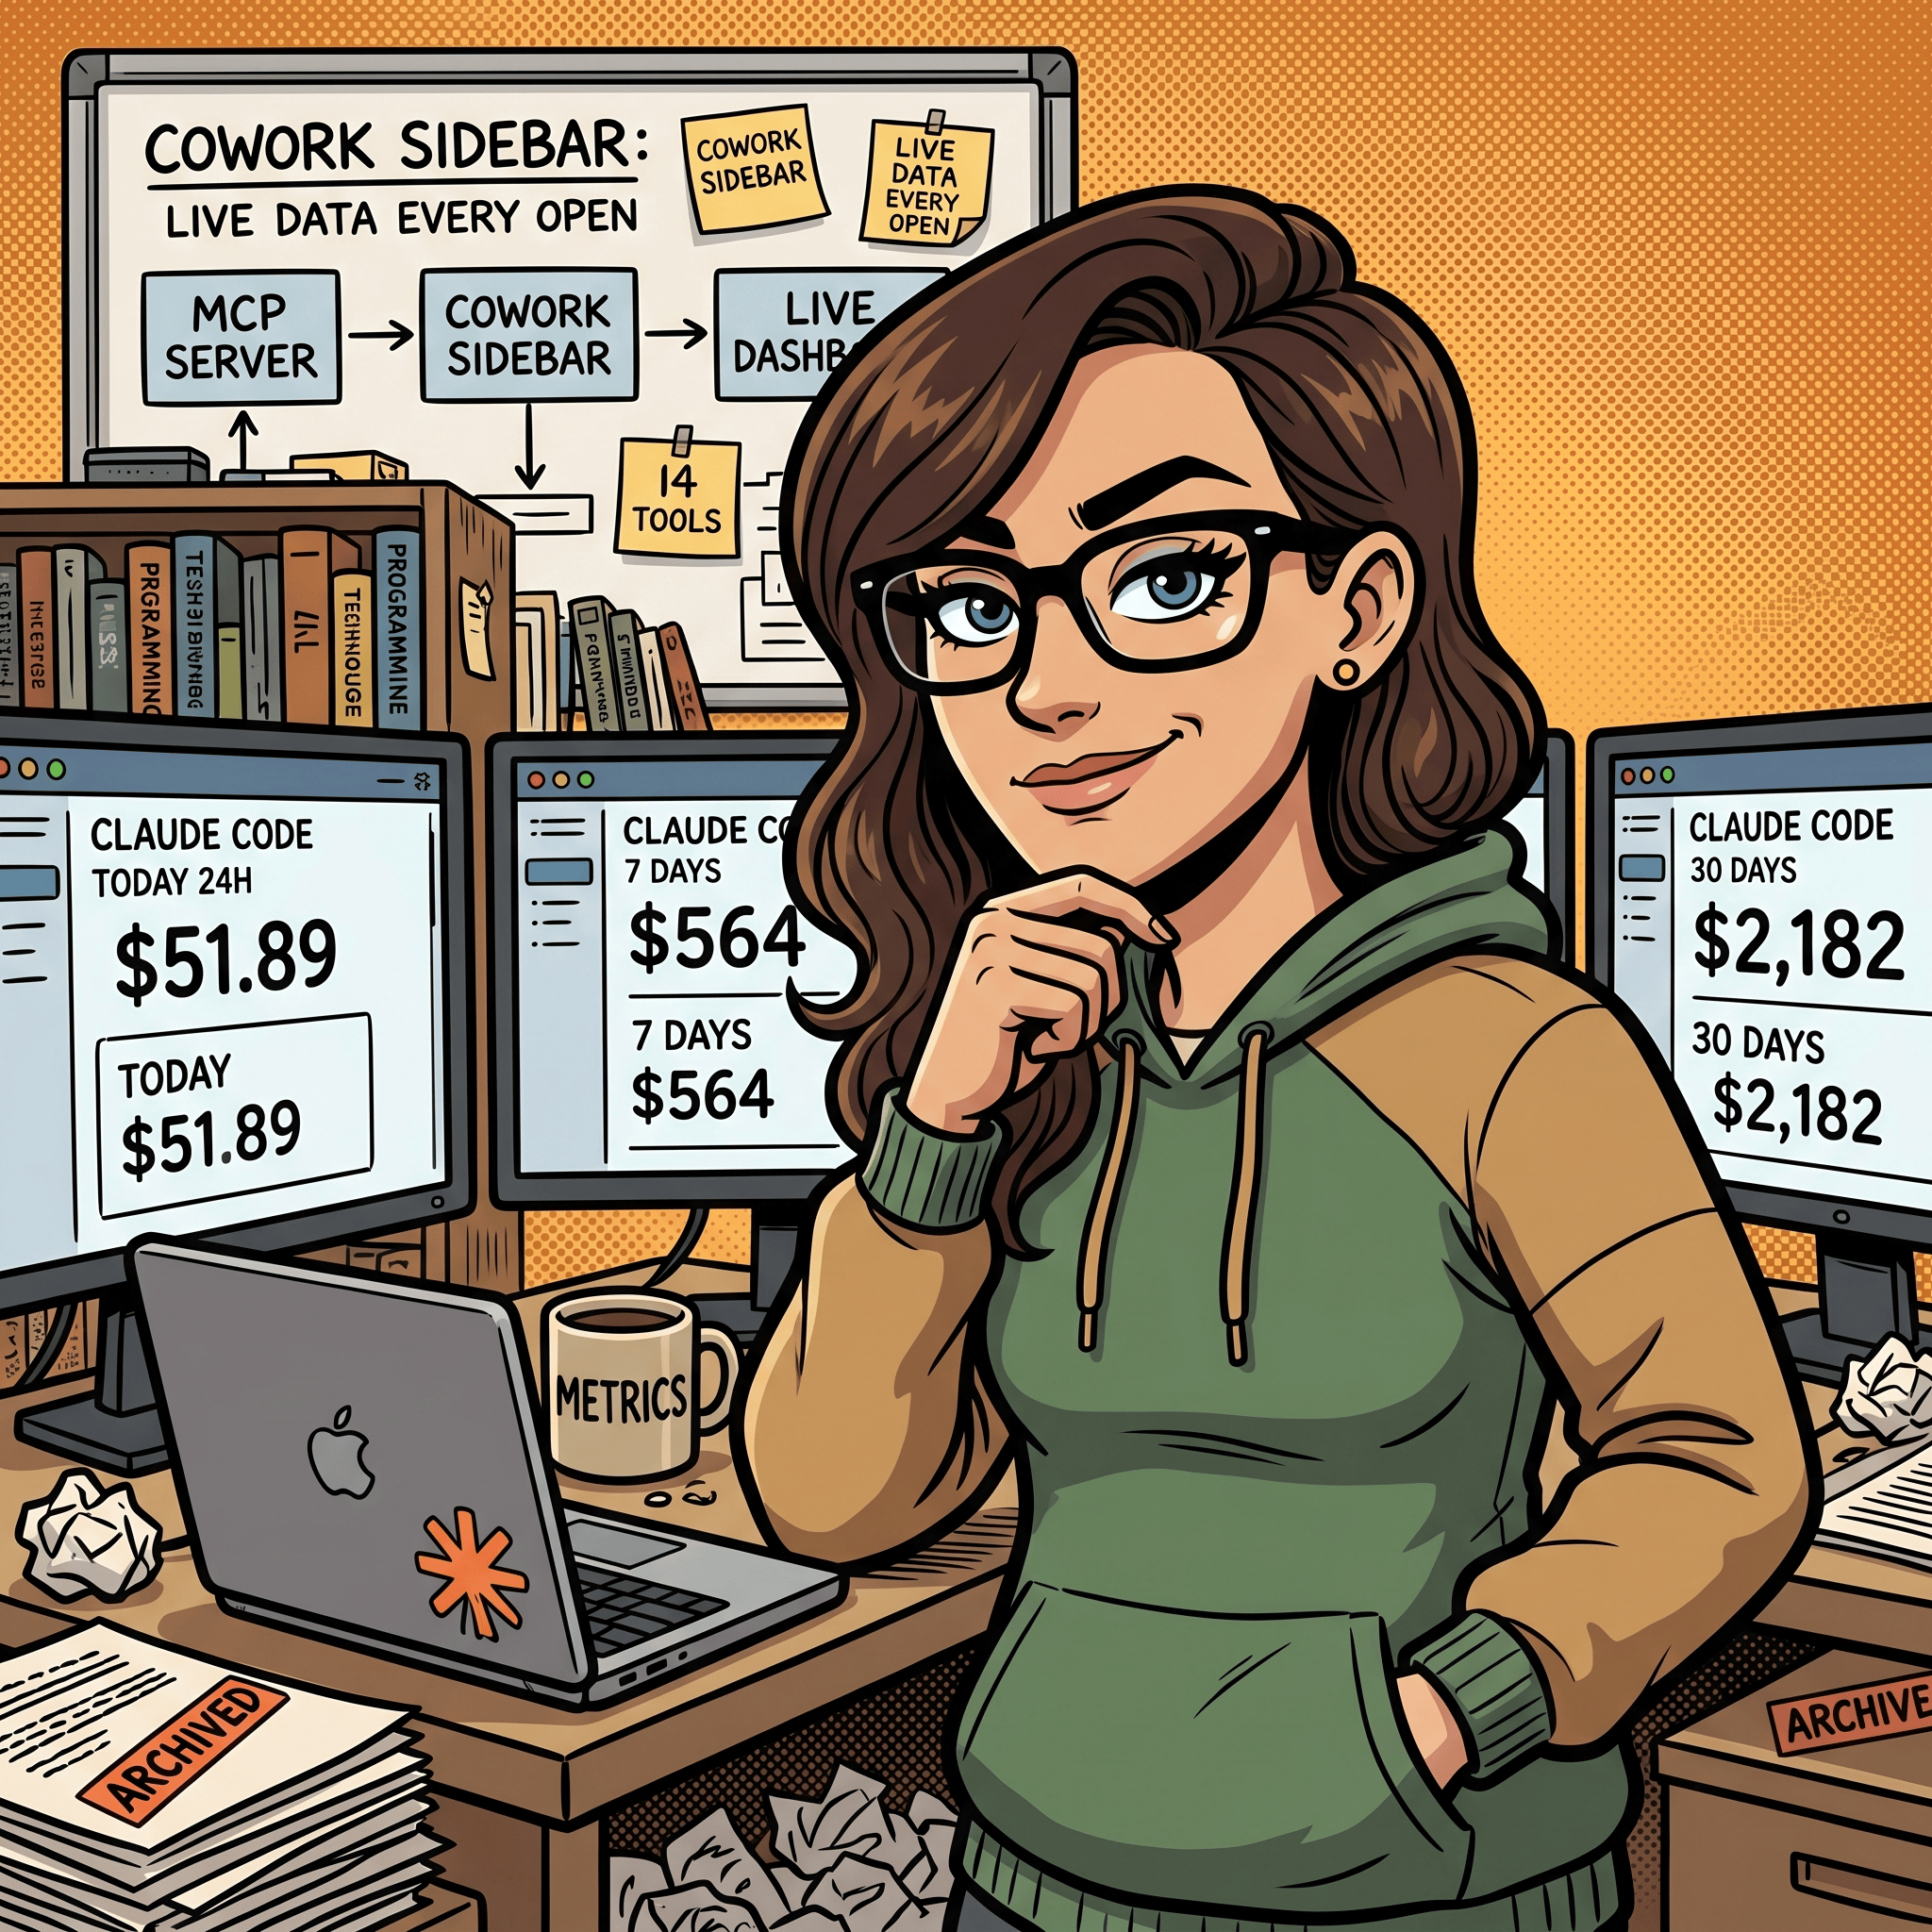
I spent the last year wiring a Prometheus + Grafana + Loki stack behind Claude Code so I could see exactly where my token spend was going. The stack is explained in detail at centminmod/claude-code-opentelemetry-setup. Short version: Claude Code emits OpenTelemetry metrics and logs, I scrape them into Prometheus and Loki running in a local Docker container, and Grafana charts them.
That was useful but it lived in a separate browser tab. So I wrote a small local MCP server on top of the same stack. It exposes 14 read-only tools over Prometheus and Loki: get_current_cost, get_token_usage, get_cache_efficiency, get_recent_prompts, get_tool_results, query_prometheus, query_loki, plus a set of Grafana panel helpers (list_dashboard_panels, get_panel_query, explain_panel_query, find_panel_by_name, explain_promql_query, explain_logql_query, get_available_metrics). Because it speaks stdio and runs on my own machine, it fits the “local MCP server” path Anthropic documents for Claude Desktop. The help center article Getting Started with Local MCP Servers on Claude Desktop is the authoritative reference for that path, and it is the right choice for any tool that should not be exposed to the public internet, like a Grafana stack bound to localhost. I had been using the server from inside Claude Code for a while. The new question was whether Claude Desktop and Cowork could see it too, and whether a live artifact on top of it would be useful.
The short answer turned out to be yes on both counts.
Step 1: adding the server to Claude Desktop
The Metrics MCP server is a local stdio server, same as every other MCP server I run. So adding it to Claude Desktop is a config edit, not a marketplace install. The desktop app reads its config from:
/Users/george/Library/Application Support/Claude/claude_desktop_config.jsonMy metrics entry looks like this:
"metrics": {
  "command": "/Users/george/.local/bin/uv",
  "args": [
    "run",
    "--directory",
    "/path/to/mcp-server",
    "metrics-server"
  ]
}
uv run --directory resolves the server’s own pyproject.toml and runs the metrics-server entry point from it. That avoids a global install and keeps Python dependencies scoped to the server repo.
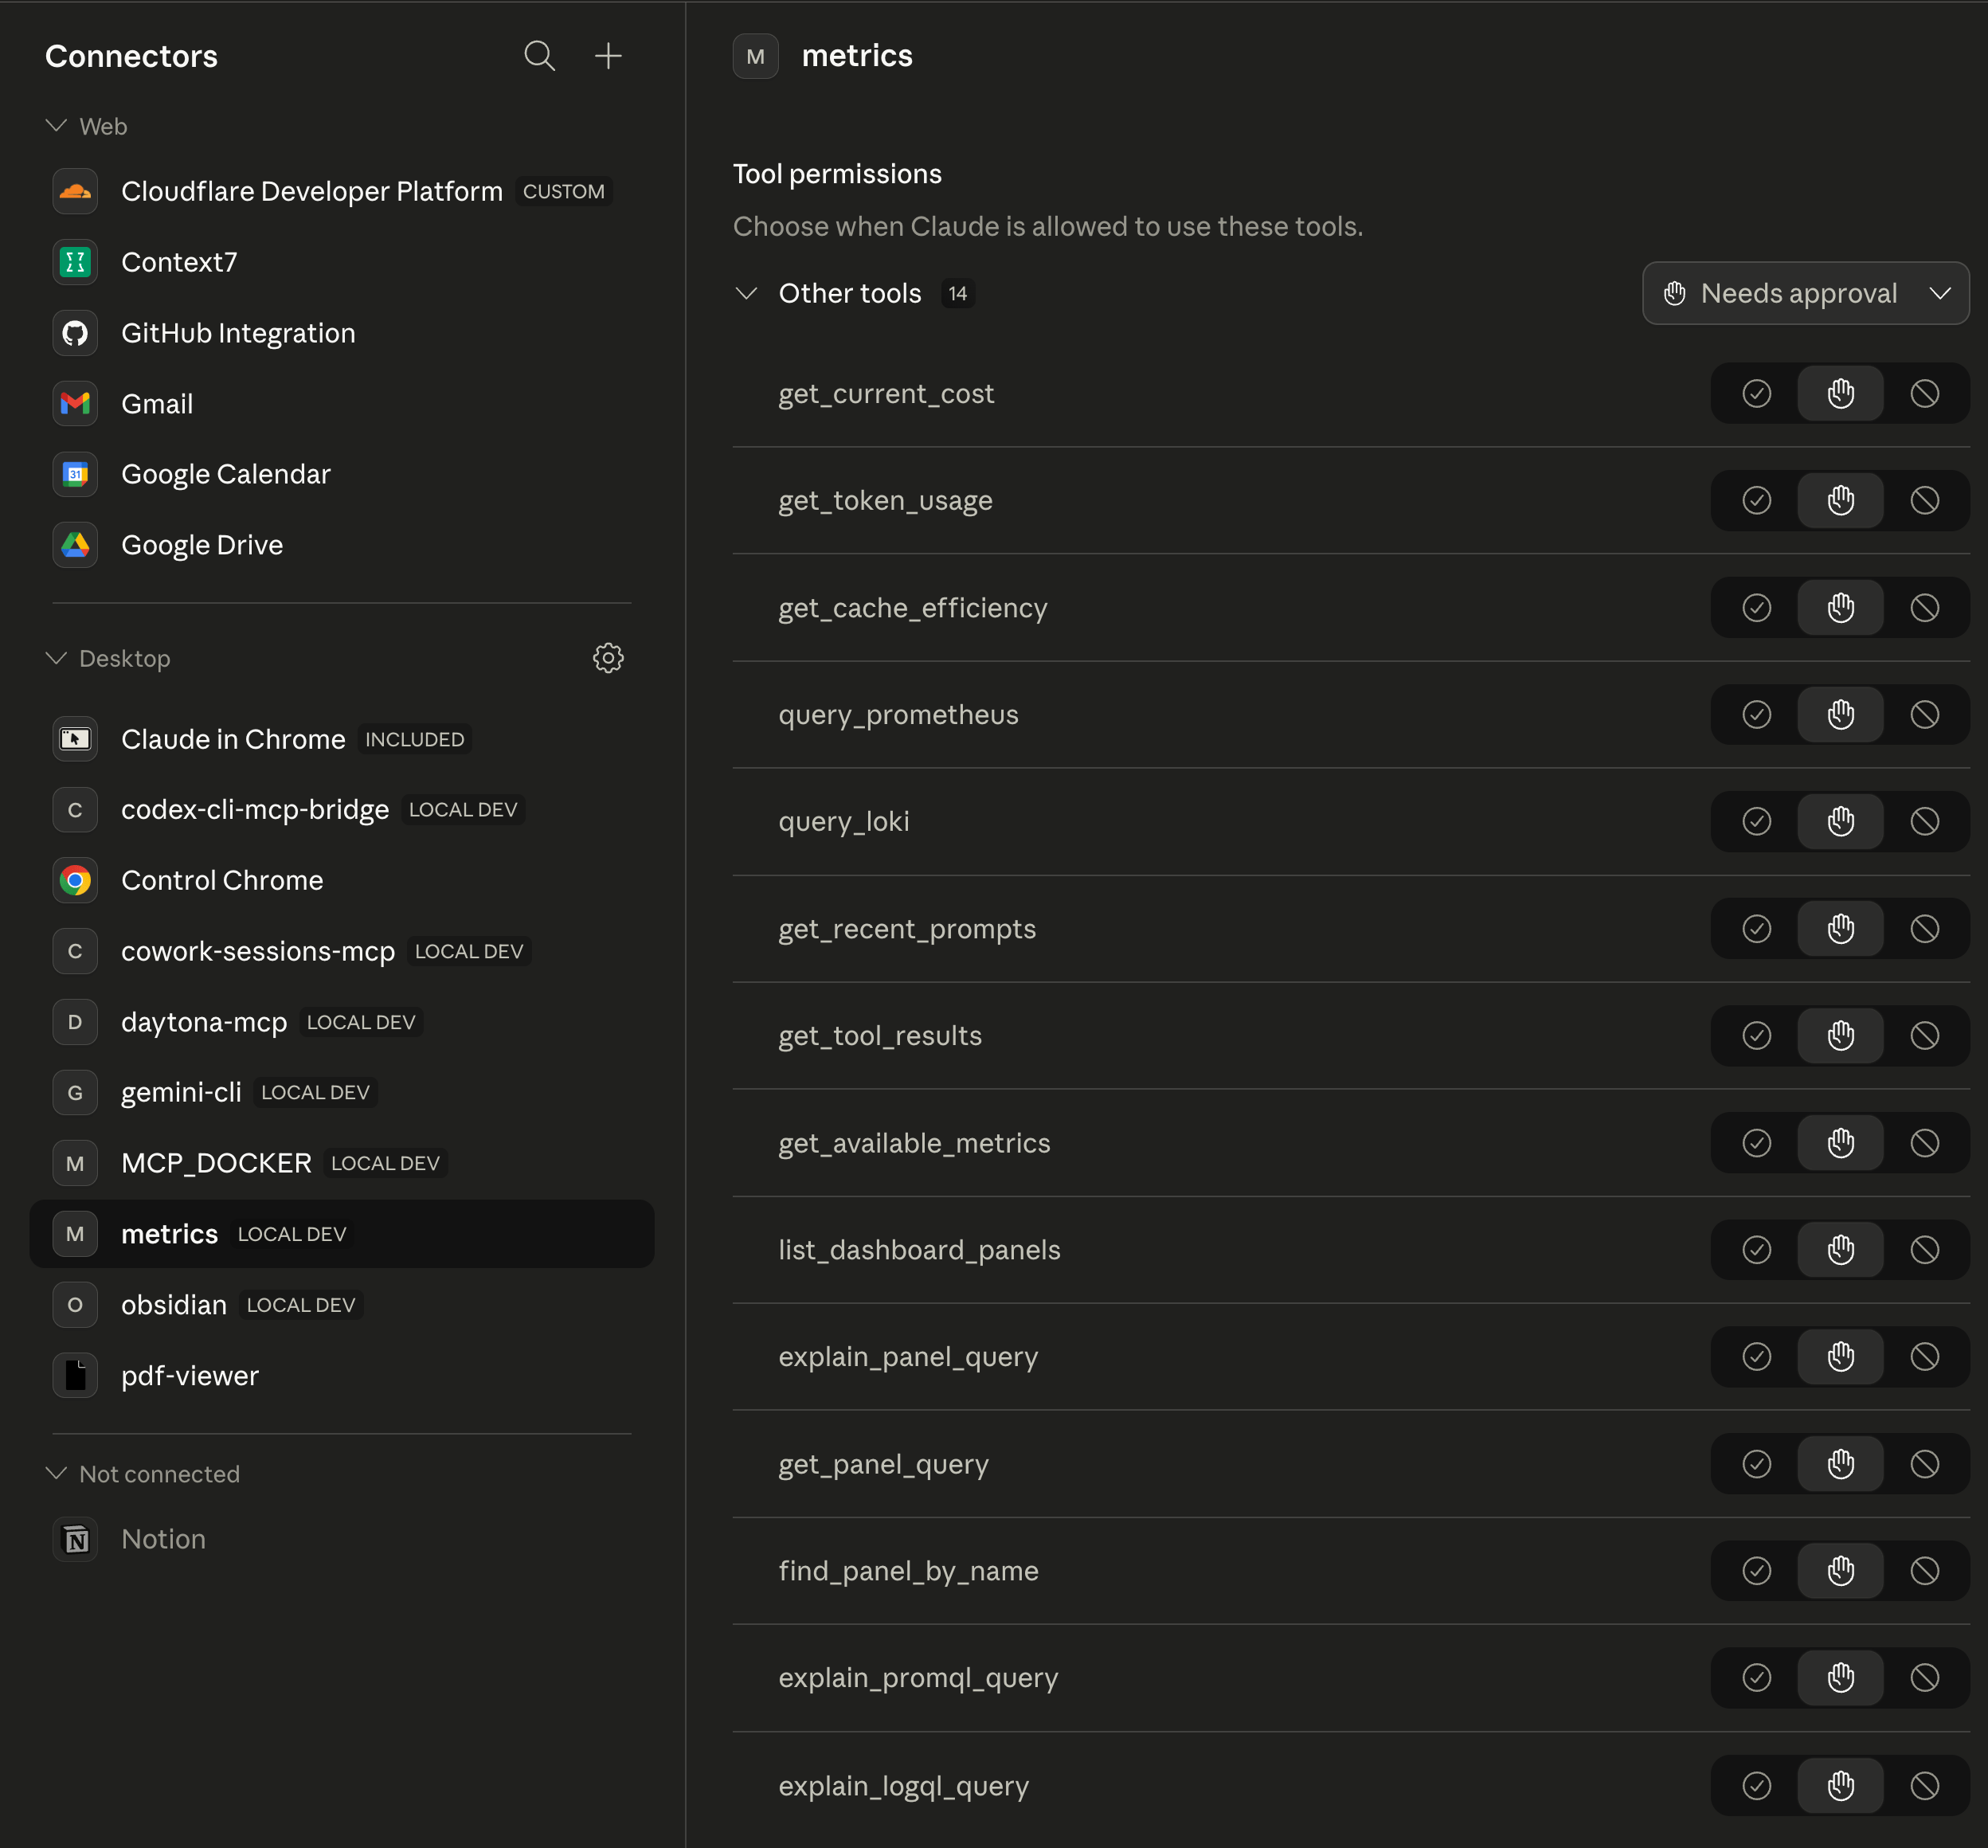
After editing the file I restarted the Claude Desktop app and opened the Connectors page. The metrics server showed up under Desktop with a LOCAL DEV tag and all 14 tools listed. Each tool defaults to “Needs approval” until I grant it a blanket permission, which matches the safety model Anthropic describes in Use connectors to extend Claude’s capabilities.

That Connectors page is the ground truth. If the server does not appear here, nothing else on the desktop side can see it, including Cowork.
Step 2: testing it in Claude Code first
I did not go straight to Cowork. I tested the server from Claude Code’s Code surface on the desktop side first, because CLI-style output makes it easy to confirm the data is real before you build a UI on top of it.
The first test was the most boring possible one:
Hi, are you able to query my metric server to get my Claude Code usage statistics?
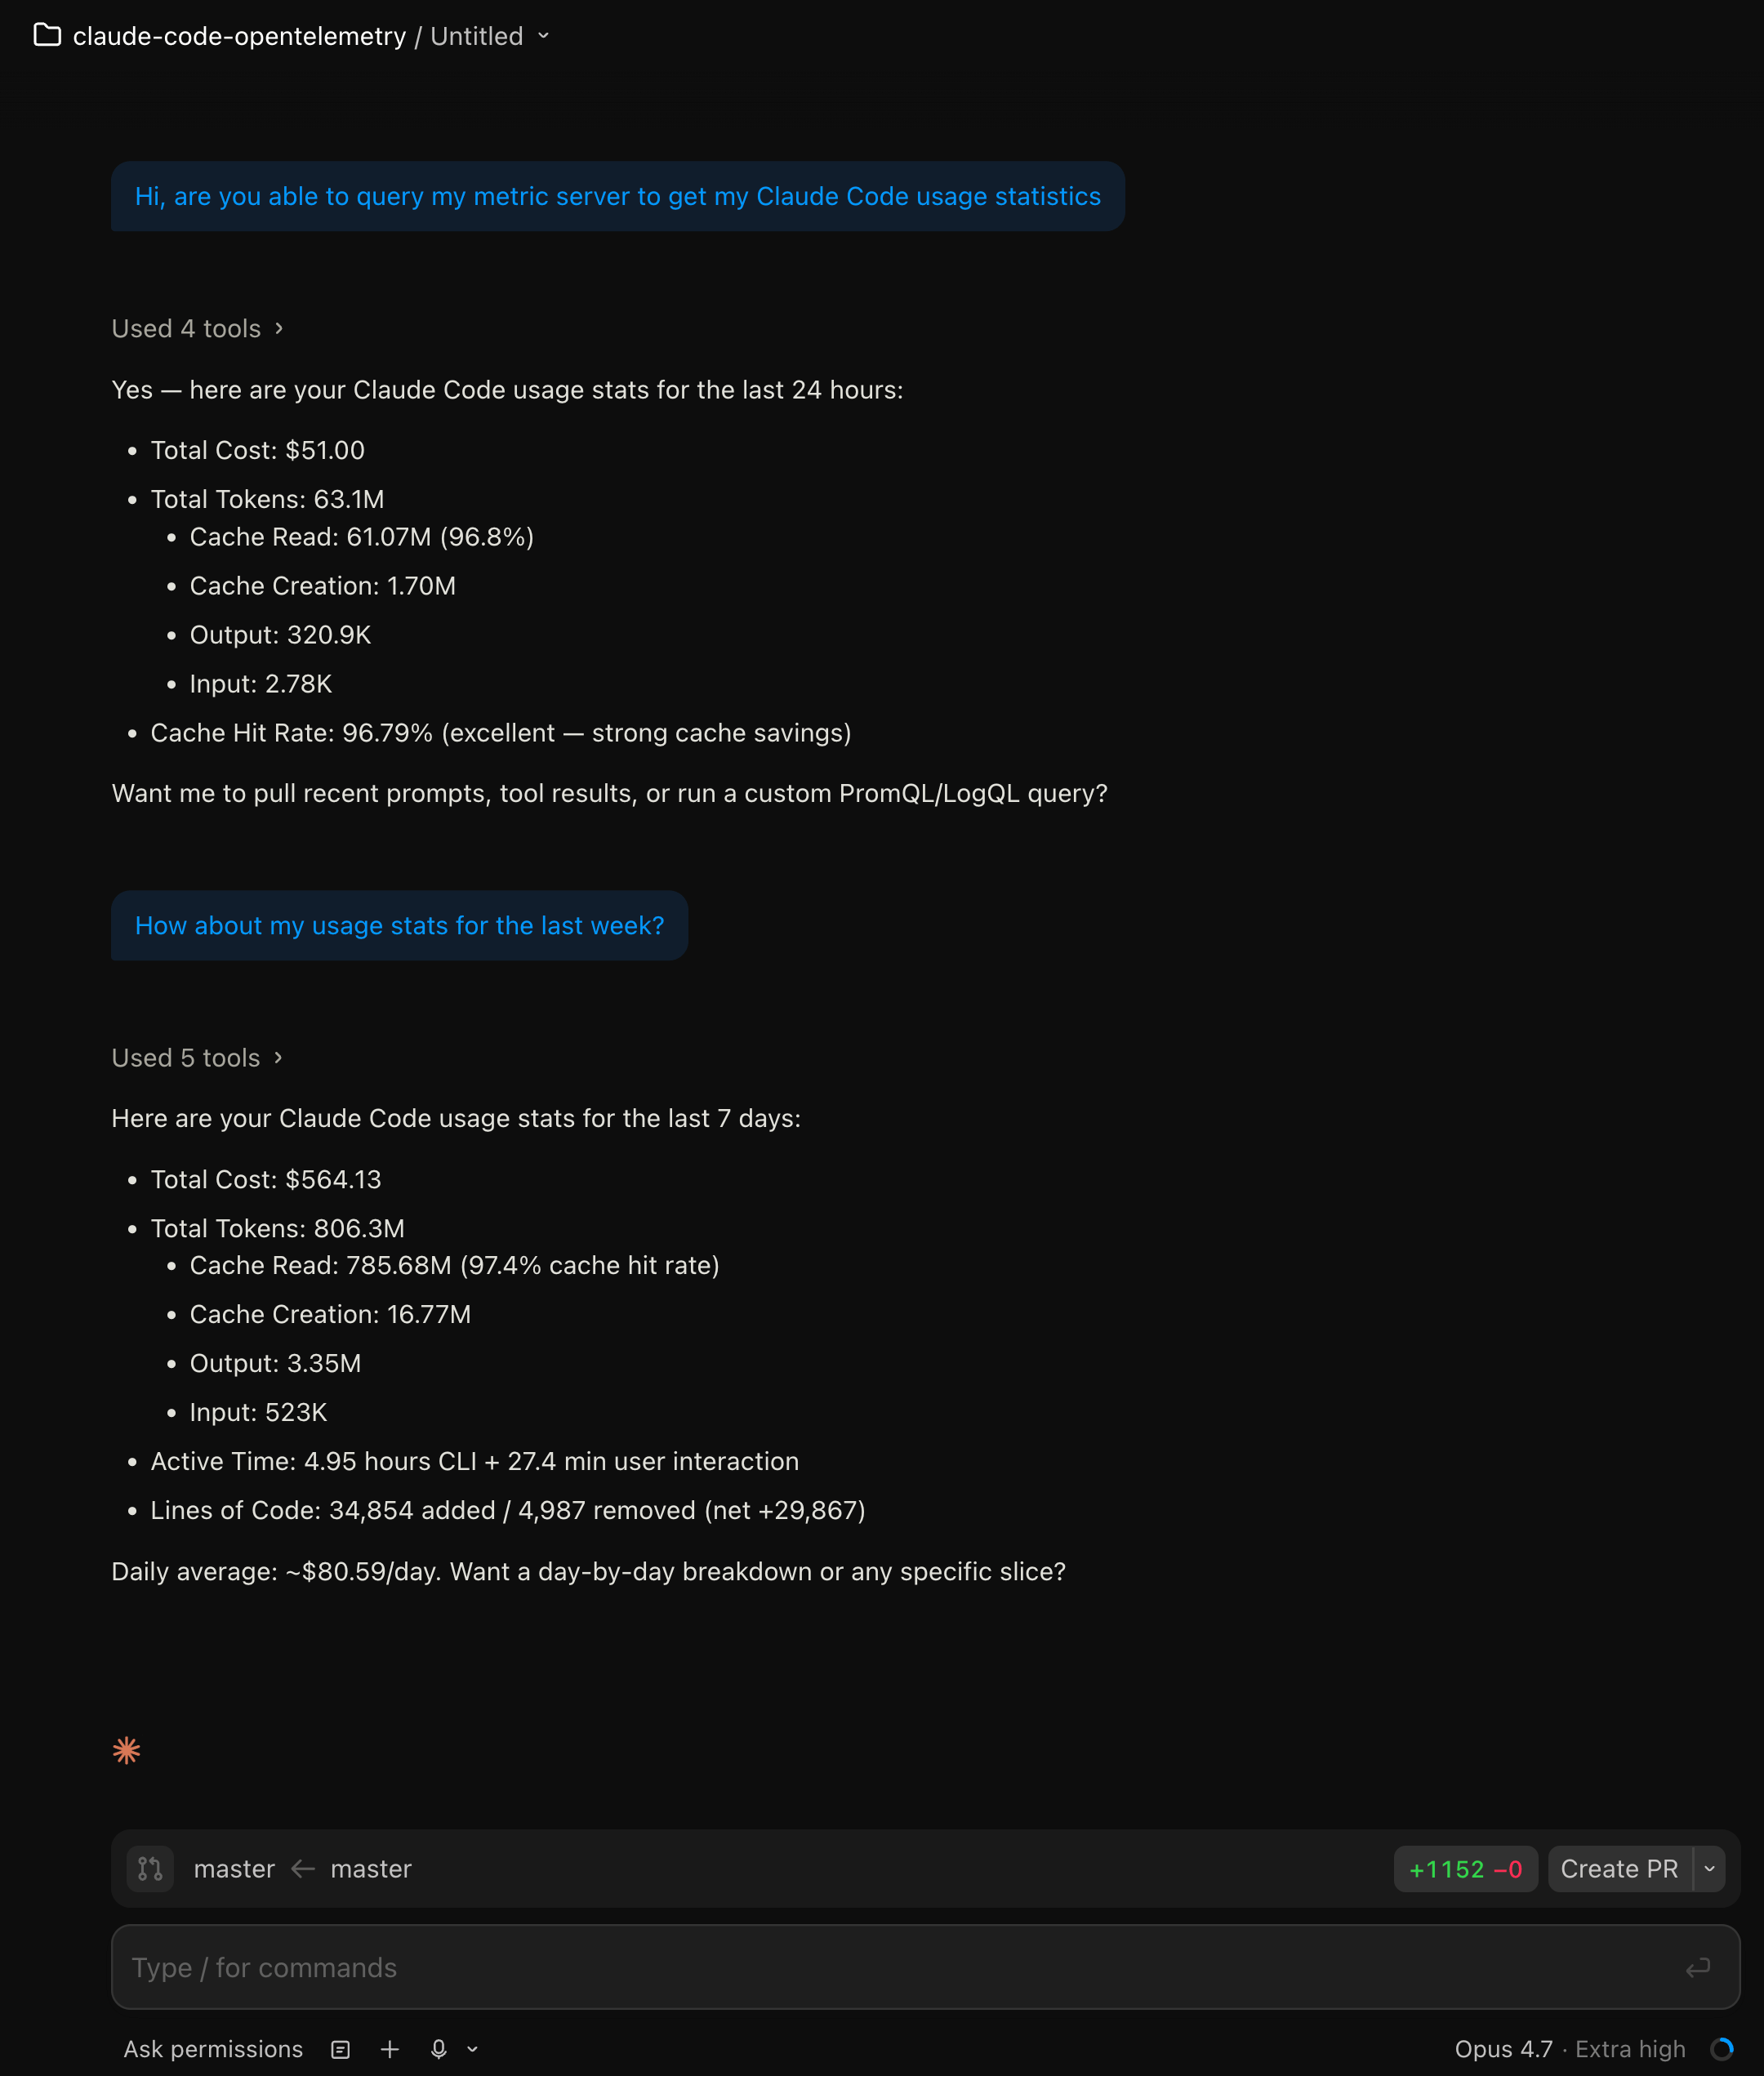
It pulled 24-hour numbers on the first pass and 7-day numbers on the follow-up. Total cost $51.00 over the previous 24 hours, $564.13 over 7 days, cache hit rate just under 97% on the 7-day window. The numbers matched what my Grafana dashboard was showing in a separate tab, so the tool was wired up end to end.
Then I asked for a combined view across three windows:
Can you use the metric server to get my Claude Code usage statistics for the past 24 hours, 7 days, and 30 days?
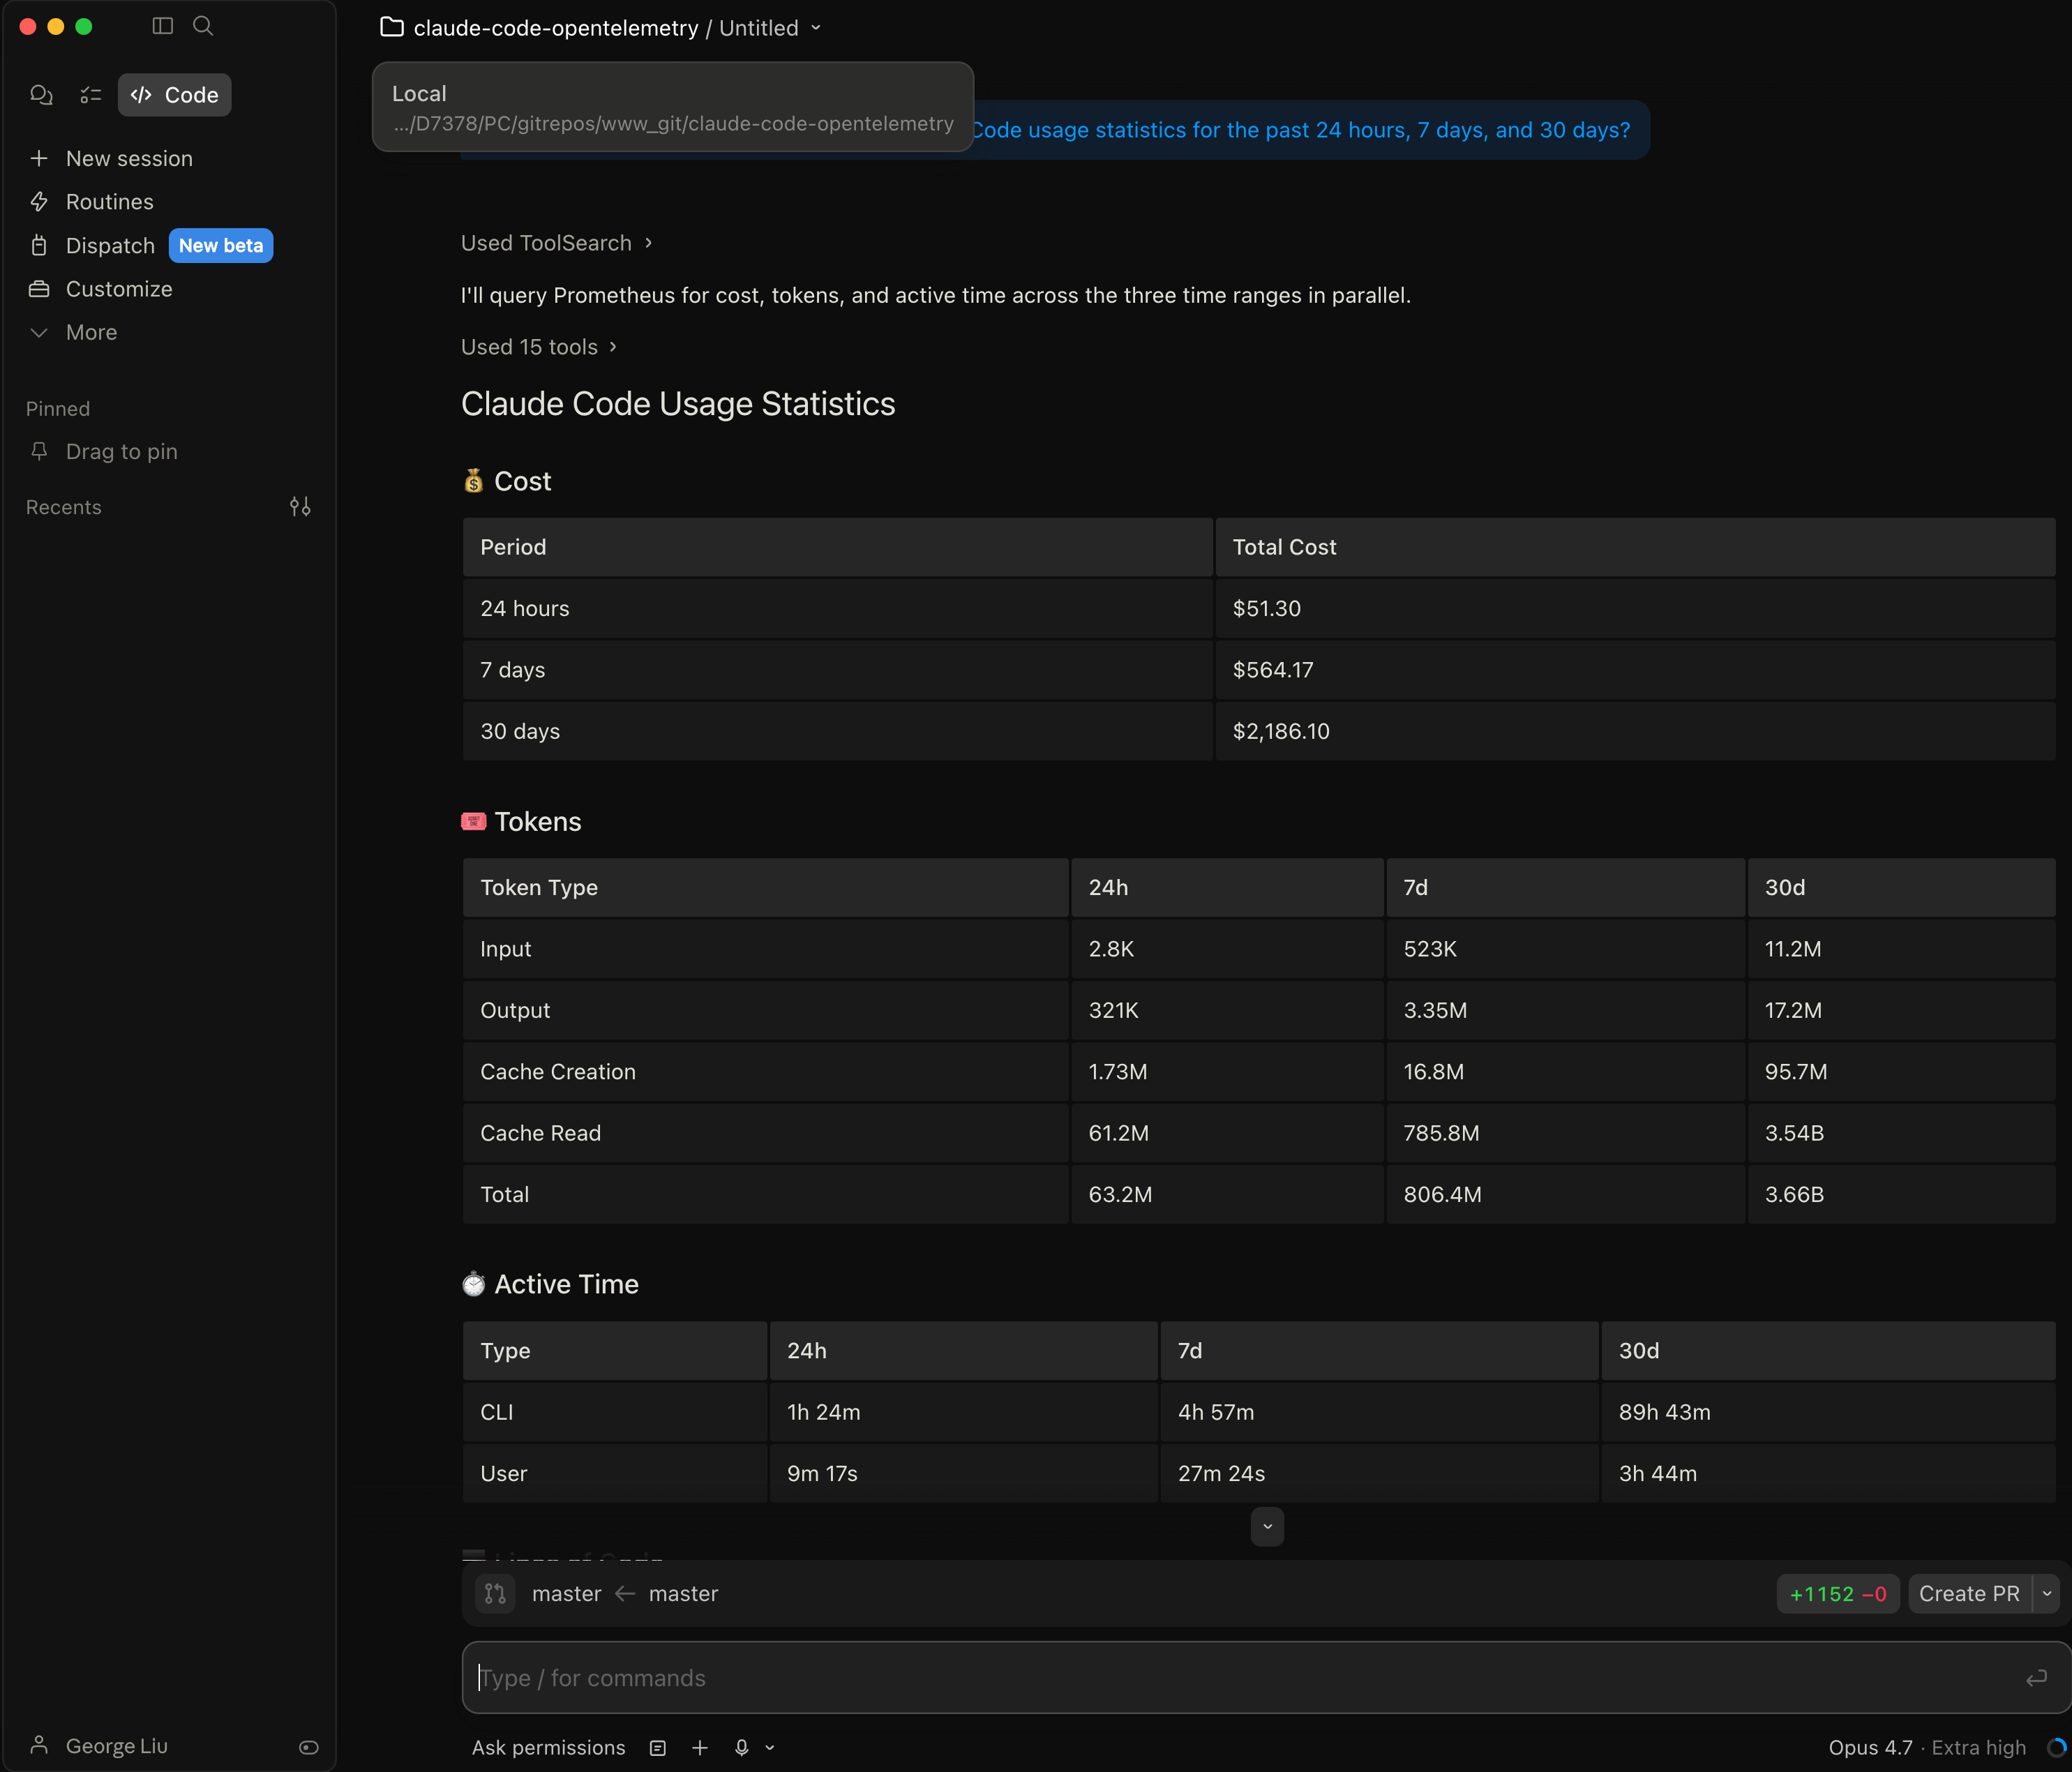
This response is more interesting than it looks. Claude ran query_prometheus in parallel across three time ranges and stitched the results into one table. 24-hour cost was $51.30, 7-day was $564.17, 30-day was $2,186.10. Active CLI time climbed from 1h 24m over the last day to 89h 43m over the month. That is what a month of Claude Code work looks like when you measure it.
I also asked how far back the data actually went, because I wanted to know the ceiling before I promised a 30-day view in a dashboard:
How far do the statistics usage collection go? How many days can I go and look up?
The answer was concrete: Prometheus retention is 30 days with a 10 GB size cap, Loki retention is 30 days (720 hours). Earliest datapoint right now is 2026-03-24, or about 30.7 days of history available. The tool read this from my docker-compose.yml and loki-config.yml and explained that anything older than 30 days is dropped because Prometheus TSDB compacts and deletes older blocks. That confirmed the dashboard’s 30-day view is the practical max.
CLI testing before UI work is a habit I keep coming back to. It is faster to type three questions into Claude Code than to watch an HTML artifact render, iterate, and rebuild. You find the shape of the data first, then you build the UI.
Step 3: first time inside Live artifacts
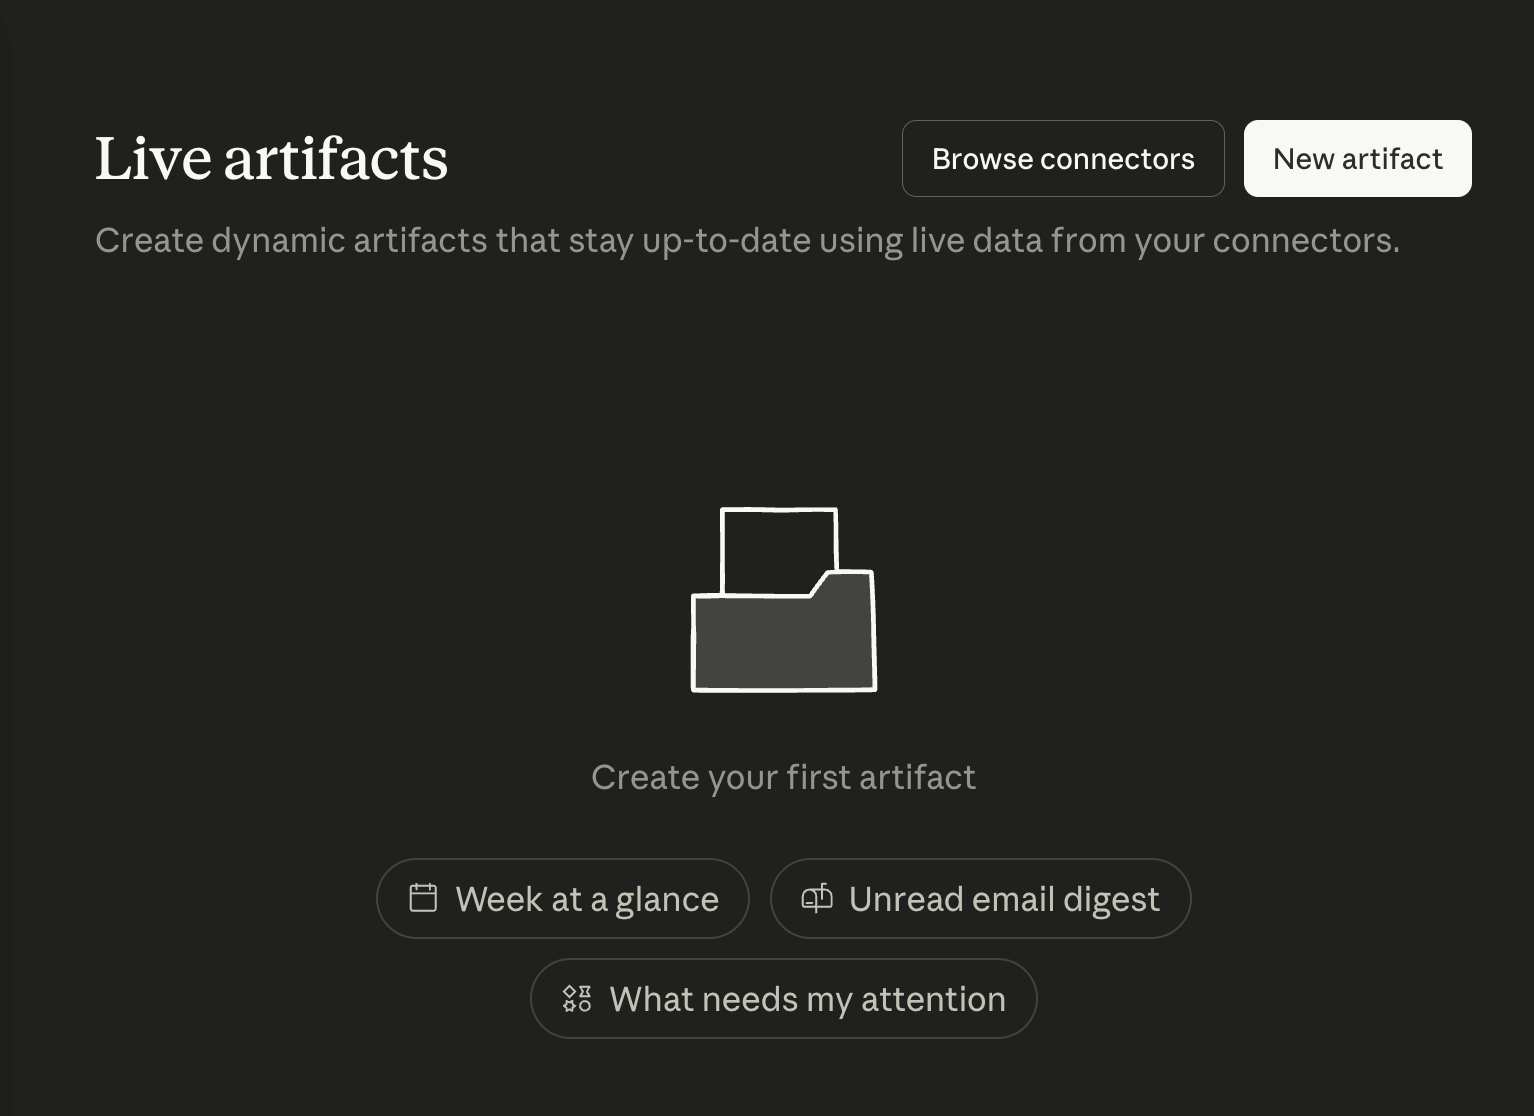
Cowork’s Live artifacts section is reached from the left sidebar. On first open it is empty, with three suggested prompts to get you started: “Week at a glance”, “Unread email digest”, and “What needs my attention”. A tagline above reads “Create dynamic artifacts that stay up-to-date using live data from your connectors.”
I clicked New artifact and typed what I actually wanted, which was not an artifact yet but a scoping conversation:
I want to make a live artifact. Explain what live artifacts are in Cowork, then look at my connectors (MCP servers), and ask me a few questions to figure out what kind of live artifact would be most useful for me.
That was the most useful prompt I wrote all session. Two reasons. First, it forced the model to define live artifacts back to me in its own words before we built anything, which exposes any wrong assumptions. Second, it grounded the design in the specific MCP servers I had connected rather than a generic template.
The model defined live artifacts correctly. It called them “self-contained HTML pages Cowork saves to your sidebar” with two key properties: “persists across sessions, so you can re-open it any time without asking me to recompute anything” and “can call your connectors (MCP servers) at open-time via a browser-side window.cowork.callMcpTool bridge, so the data refreshes with current state every time you open it.”
Then it produced a punch list of everything it could see in my connectors: Obsidian vault, Cloudflare (D1, KV, R2, Workers, Hyperdrive), Claude usage metrics (Prometheus/Loki, cost, cache efficiency, dashboard panels), Google Drive, scheduled tasks, Context7 library docs, Cowork session history, browser-control MCPs. From that list it proposed seven plausible artifact directions with trade-offs for each: an Obsidian “today” dashboard, a Cloudflare infra inventory, a Claude cost and usage tracker, a Drive recent-files explorer, a scheduled-tasks control panel, a Context7 lookup pane, and a unified morning dashboard.
I declined it’s suggested connectors and I picked my Claude Code usage metrics MCP server as a live artifacts health dashboard.
Step 4: probe the tools before you build
This step is the one I want other Cowork users to copy verbatim. Before Claude built anything, it wrote this plan:
Plan: probe each metrics tool once to see the real response shapes, then build a single artifact with all six shapes as sections, a time-window toggle (today / 7d / 30d), and a model breakdown where the data supports it. Once you’ve lived with it for a day you can tell me which sections to cut and I’ll trim.
Then it ran each tool once with a minimal payload, read the actual response, and told me what it saw. That is a pattern worth naming.
The Cowork system prompt for artifacts actually instructs Claude to do this. The guidance reads: “Probe the tool before you build. Before writing an artifact that calls a connector tool, call that tool once in chat with a small representative payload and look at the actual response. MCP wrappers often rename parameters and reshape or stringify output relative to the underlying service’s native API, so don’t assume the shape.” That guidance is in Cowork’s built-in instructions, and you can see it in action in my session when Claude asked approval for seven probe calls in a row before touching the artifact. The same principle maps onto Anthropic’s framing of interactive connectors more generally: the announcement post describes the feature as “collaborate in real time” with the tool, which only works if the first interaction with the tool is a small read, not a speculative write (Interactive connectors and MCP Apps).

After the probe, it reported:
All queries validated. Cost by model shows your real split (Opus 4.7 dominates, Sonnet 4.6 secondary, plus some local models). 7d total is ~$565, 30d is ~$2182, 24h cache hit rate is ~97%. Good grounding to build on.
Two things are worth noting here. The 7-day and 30-day totals now match the earlier Claude Code CLI numbers to the dollar, which means the artifact’s data source and the CLI’s data source are the same Prometheus series. And the “Opus 4.7 dominates” observation is something only the real probe could surface, because the dataset itself has the answer inside it.
Step 5: approving the artifact
Before the artifact writes any HTML, Cowork surfaces a single approval dialog that shows exactly what the artifact will do and which connectors it will be allowed to call on future opens without asking again. This is where you decide how much autonomy to give the page.
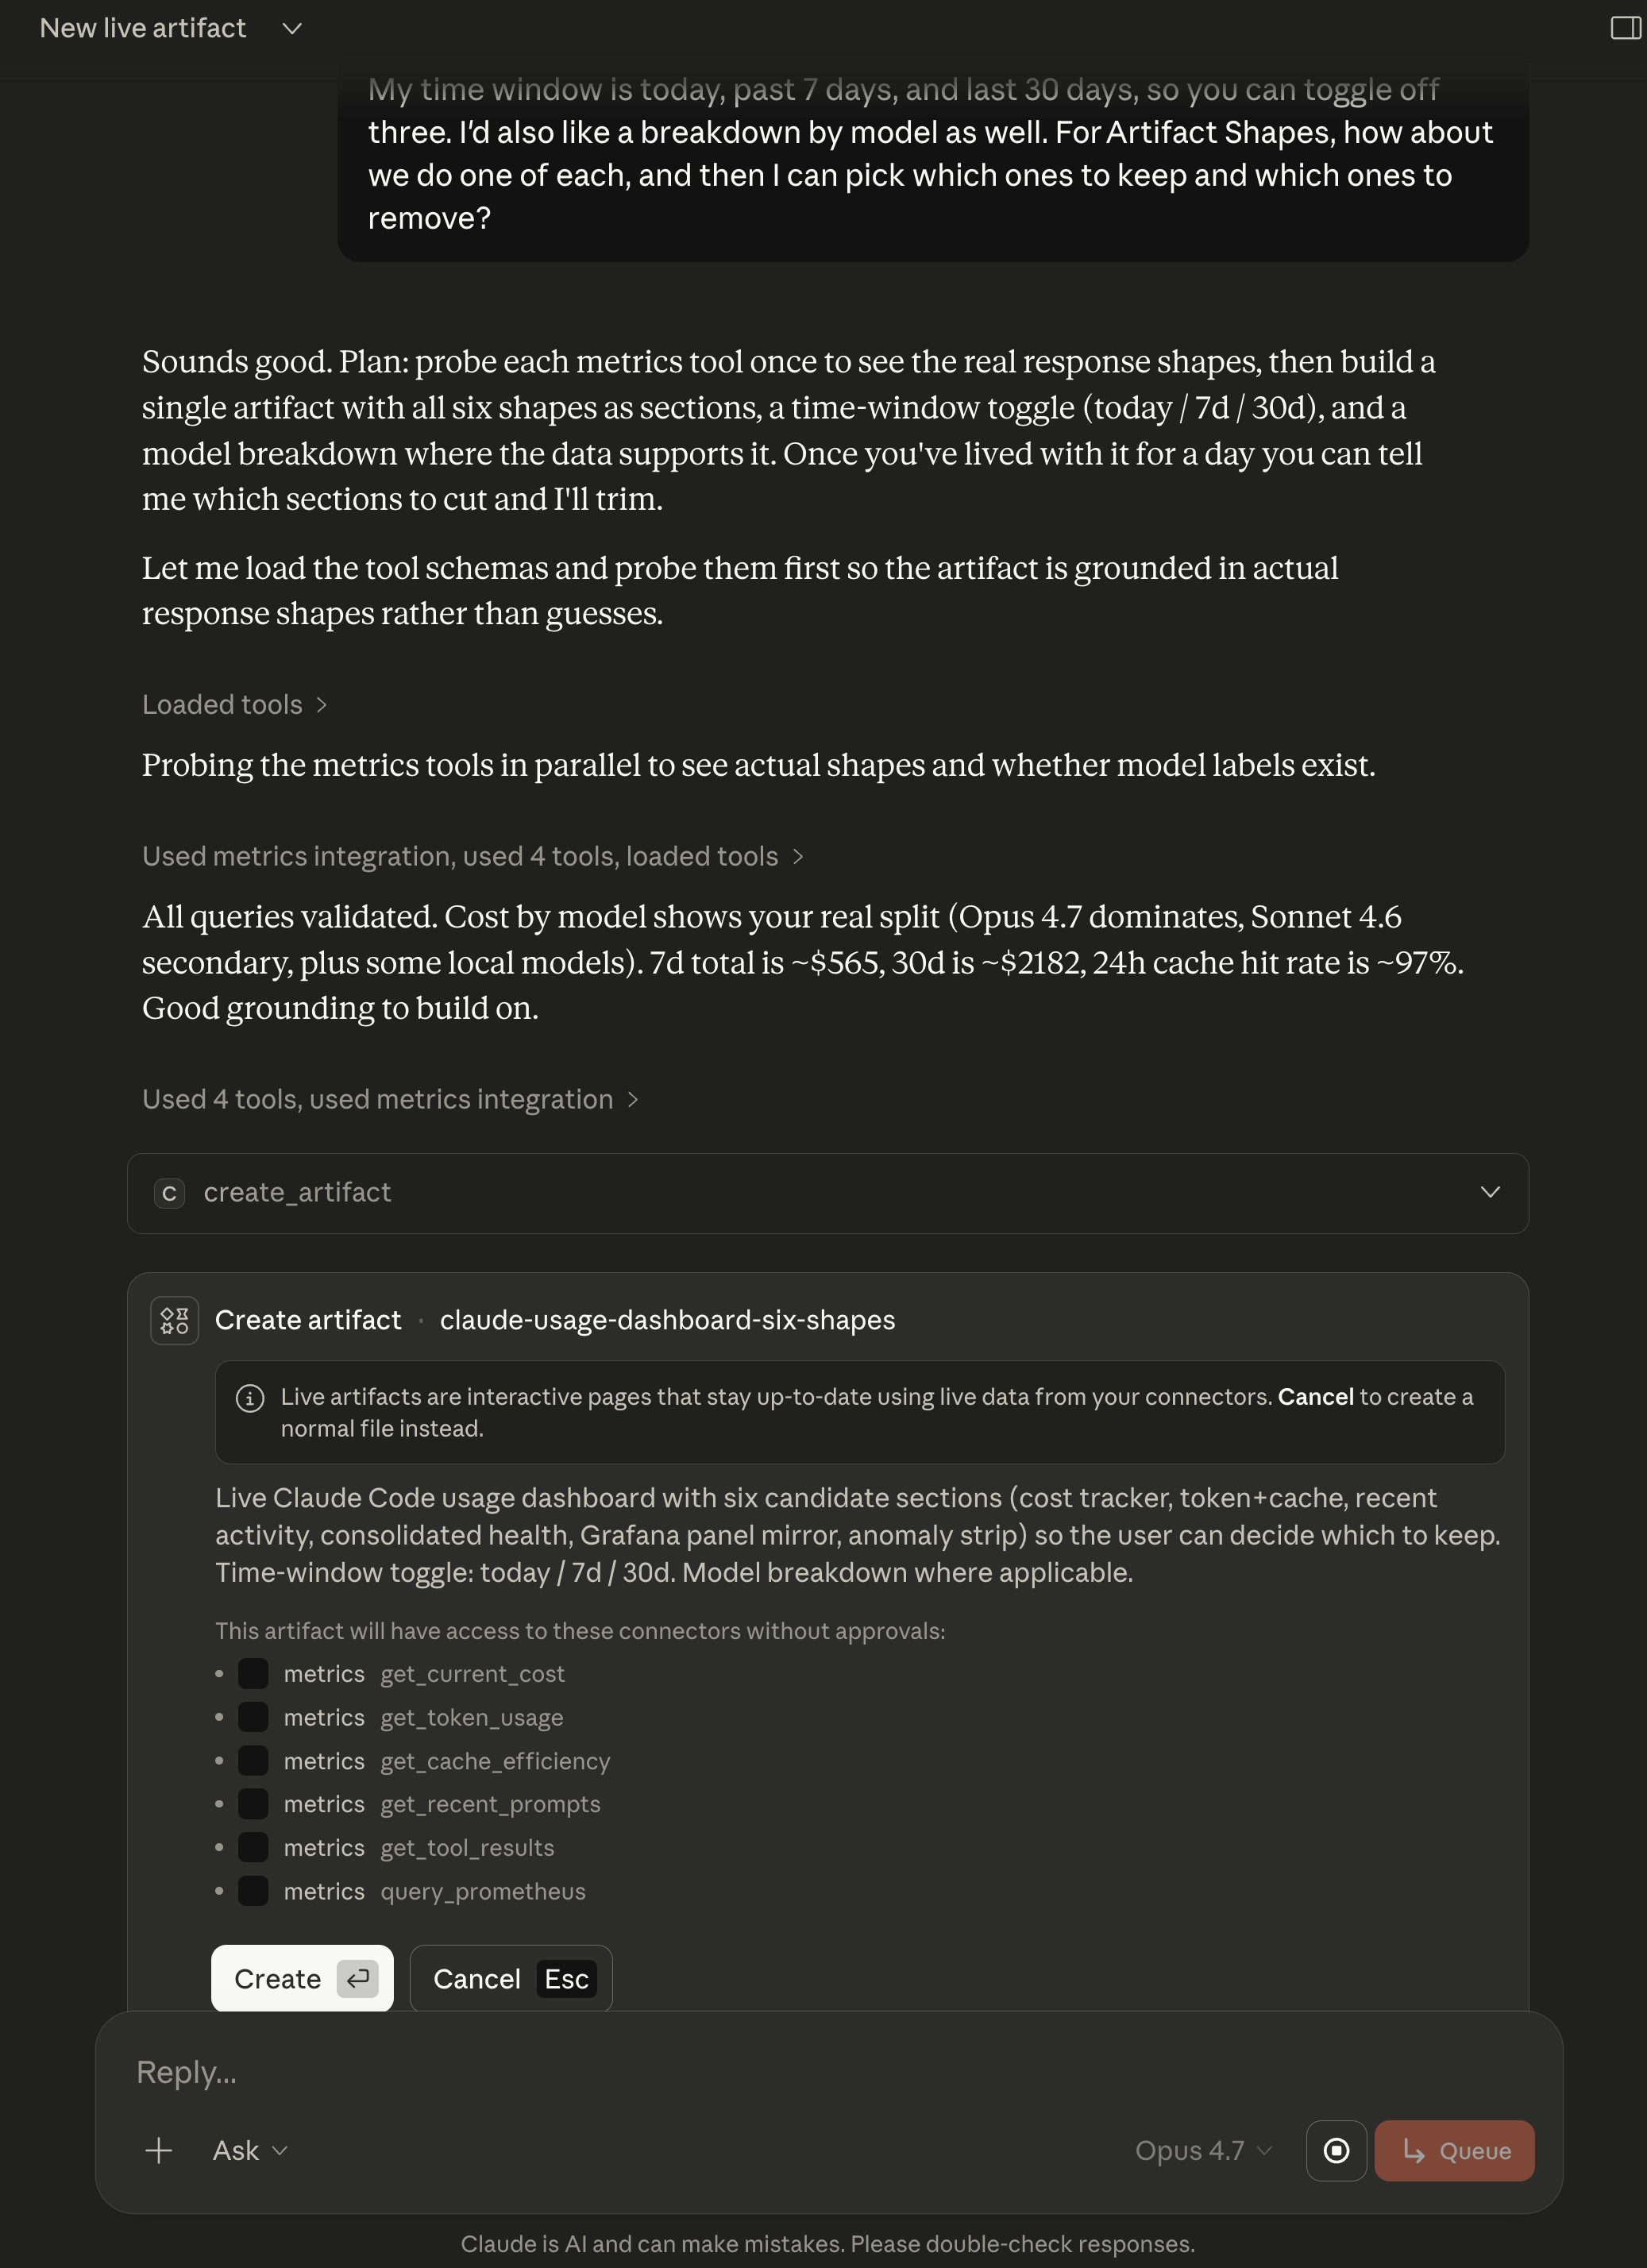
Two things to look at on this dialog. The list of connector tools is narrow and explicit. My artifact gets get_current_cost, get_token_usage, get_cache_efficiency, get_recent_prompts, get_tool_results, and query_prometheus. Those are all read-only. No writes, no deletes, no Loki log access (the Grafana panel mirror ended up being served by query_prometheus alone). The scope is smaller than what the MCP server exposes.
And the description is a capsule summary of the build, which is useful later. When I come back to this sidebar item in three weeks I will see the six candidate sections in one glance and know what the artifact does without opening it.

I clicked Create. The artifact appeared in the sidebar about twenty seconds later.
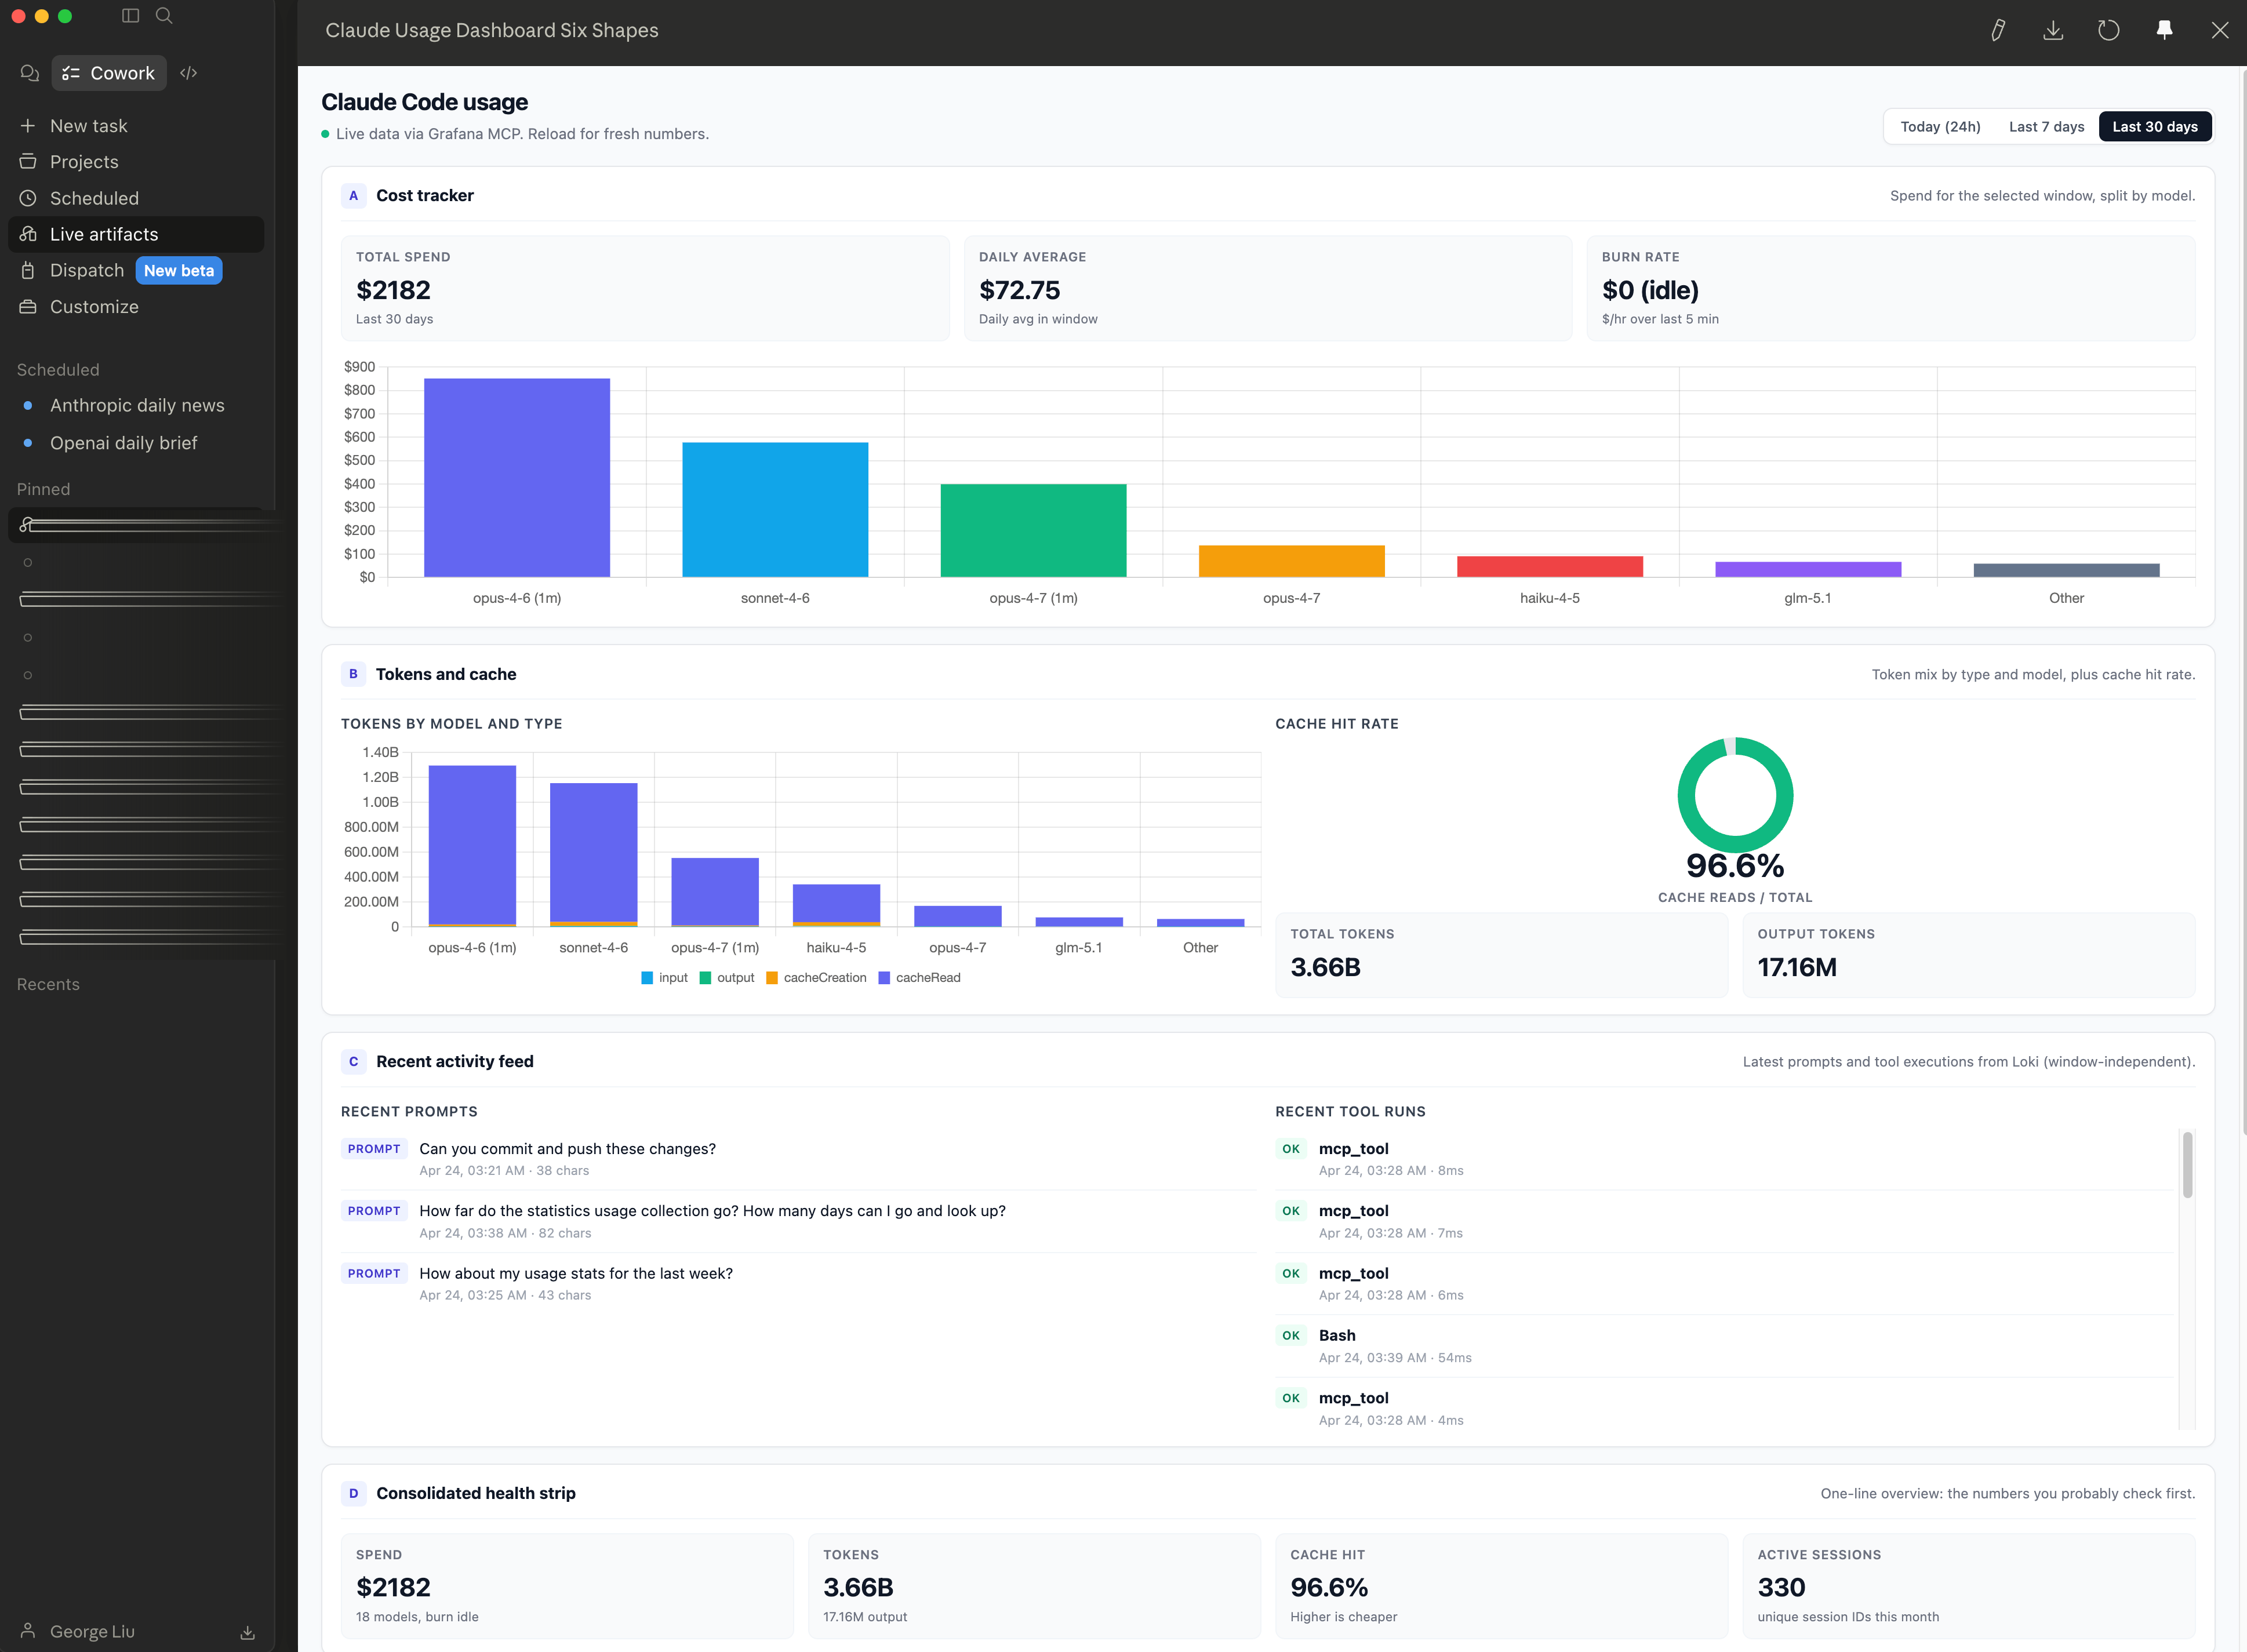
Step 6: the finished dashboard
What landed in the sidebar is a single HTML page with a time-window toggle at the top (Today 24h / Last 7 days / Last 30 days) and six stacked sections. Switching windows is instant because all three windows are fetched on load; only a manual Reload re-queries the connector.
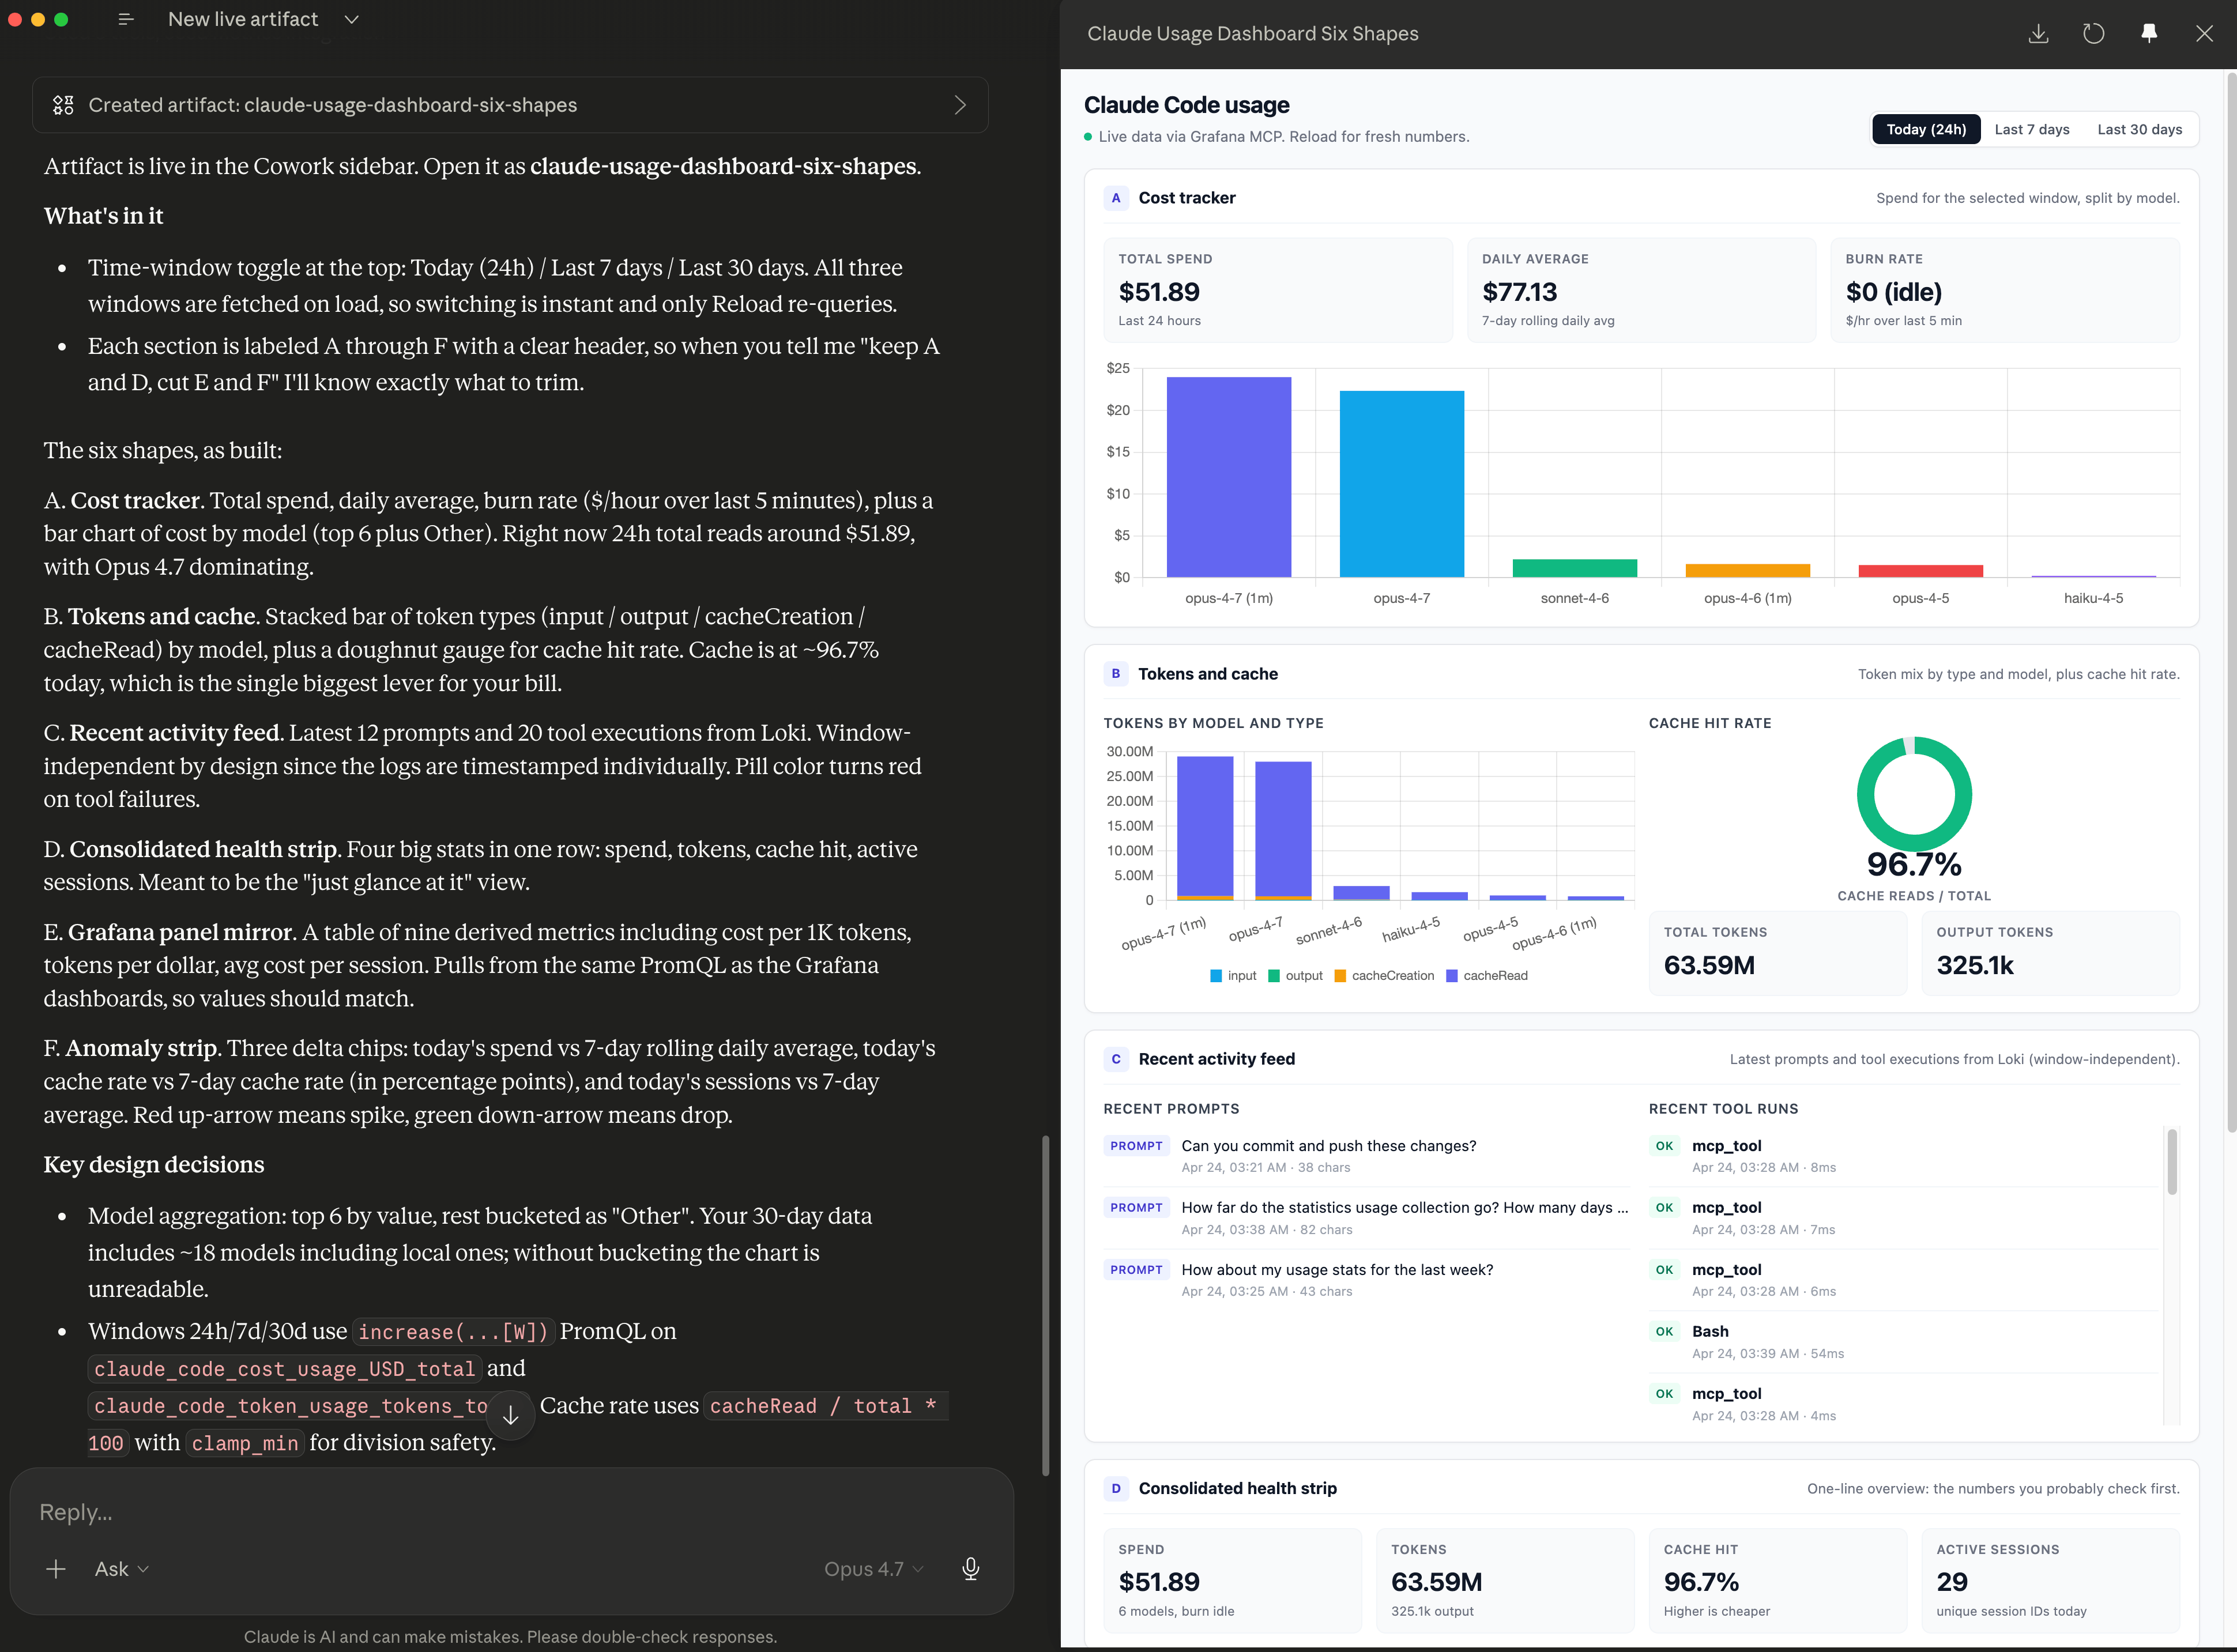
The six sections are:
Cost tracker. Total spend, daily average, burn rate, plus a bar chart of cost by model (top 6 with everything else bucketed as Other). For the 24-hour window, total spend is $51.89 and Opus 4.7 dominates the bars.
Tokens and cache. Stacked bar of token types (input, output, cacheCreation, cacheRead) by model, plus a doughnut gauge for cache hit rate. Cache is at 96.7% today. That is the single biggest lever on my bill.
Recent activity feed. Last 12 prompts and 20 tool executions from Loki, time-stamped individually and window-independent by design.
Consolidated health strip. Four big stats in one row: spend, tokens, cache hit rate, active sessions. Meant for the fast-glance view.
Grafana panel mirror. A table of nine derived metrics (cost per 1K tokens, tokens per dollar, avg cost per session, and so on). Pulls from the same PromQL as my Grafana dashboards, so the values should match.
Anomaly strip. Three delta chips: today’s spend vs 7-day rolling daily average, today’s cache rate vs 7-day cache rate (in percentage points), today’s sessions vs 7-day average. Red up-arrow for a spike, green down-arrow for a drop.
When I flip to the 30-day toggle the numbers shift cleanly: total spend $2,182, daily average $72.75, total tokens 3.66 billion, cache hit rate 96.6%, active sessions 330. Those numbers are what three weeks of Claude Code and Cowork usage look like on my account. They are also the only numbers on my screen that recompute automatically. If I reopen this dashboard tomorrow morning over coffee, the “Today” column will reflect yesterday’s work without me touching a chat window.
The sidebar entry itself shows the artifact’s title, a one-line description (“Live Claude Code usage dashboard with six candidate sections…”), and a “2 minutes ago” last-opened stamp. It is a real object I can return to, not a scroll position in a chat.
What didn’t work
Three honest notes before I make this sound too clean.
First, my first attempt at the prompt was too prescriptive. I tried to dictate which sections to include up front. The artifact that produced was rigid and did not reflect the real shape of my data. The fix was the scoping conversation in Step 3, which let the model see my connectors before locking in the section list.
Second, the anomaly strip was not useful on day one. With only a few hours of “today” data, the delta chips compared a partial day to a full 7-day average and flagged everything as anomalous. I kept the section in the artifact but realized I probably need either a minimum-sample guard or a “day is still in progress” badge before it gives reliable signal. That is an iteration for later, not a blocker for day one.
Third, the 30-day window bumps up against the Prometheus retention ceiling. My earliest datapoint is 2026-03-24. If I want a true trailing 30 days every day, I either need to raise --storage.tsdb.retention.time and scale the 10 GB size cap, or export older blocks to a long-term store. The dashboard does not know that today; it just shows whatever is in the window.
What I learned
The feature earns its keep when the data changes and you will reopen it. That is the filter I will use for every future artifact. A live artifact for a one-time answer is wasted effort. A live artifact for a thing you want to glance at tomorrow morning is a dashboard you just built without the Grafana overhead.
Probe first, build once. The “probe each tool once with a small payload and read the actual response” pattern was the single biggest accuracy gain in this build. I have had similar wins in regular MCP work, but the Cowork system prompt actually instructs the model to do this for artifacts, which makes the pattern automatic. If you are building your own Cowork artifacts, ride that. If you are writing your own MCP tooling for agents, borrow it.
Scope the connector list tighter than the MCP server exposes. The approval dialog showed exactly six tools out of fourteen my server exposes. The other eight (query_loki, the Grafana panel helpers, raw metric listings) were not needed for this artifact and were correctly left out. Narrower scope means fewer surprise permission prompts later and a smaller blast radius if the HTML is ever shared.
CLI test the data before you build the UI. Three prompts in Claude Code confirmed the data shape before Cowork did any rendering. That saved at least one iteration. It also let me discover the 30-day retention ceiling before I built a UI that promised longer windows.
The sidebar changes the cost calculus. A chat artifact costs a model round-trip to rebuild. A live artifact costs one round-trip to build and then local JavaScript to reopen. Over a month of reopens, the math on a daily-glance dashboard is hugely in the live artifact’s favor.
What’s next
Three things I want to do with this first artifact.
Trim the six-section layout down to four. Cost tracker, tokens and cache, consolidated health strip, and Grafana panel mirror are the four I actually look at. The recent activity feed is nice but I have Grafana for that. The anomaly strip needs the minimum-sample guard before it carries weight.
Build a morning dashboard that unions the metrics artifact with my Obsidian daily note. The sketch the model offered in Step 3 mentioned this pattern, and it is the most obvious next step: one page that tells me what I spent yesterday on Claude Code and what I told my own second brain I should be working on today. This is exactly the kind of workflow Anthropic positions Cowork around on its product page: “agentic AI for knowledge work” that moves between your files and apps so the coordination work drops off your plate.
Write a short Cowork-specific note on artifact prompting patterns. The “define it back to me, look at my connectors, ask me questions” prompt was unusually productive. I want to turn that into a reusable template.
If you’re interested in practical AI building for web apps, developer workflows, and infrastructure, subscribe for future posts. You can also follow my shorter updates on Threads (@george_sl_liu) and Bluesky (@georgesl.bsky.social) or subscribe and follow along.